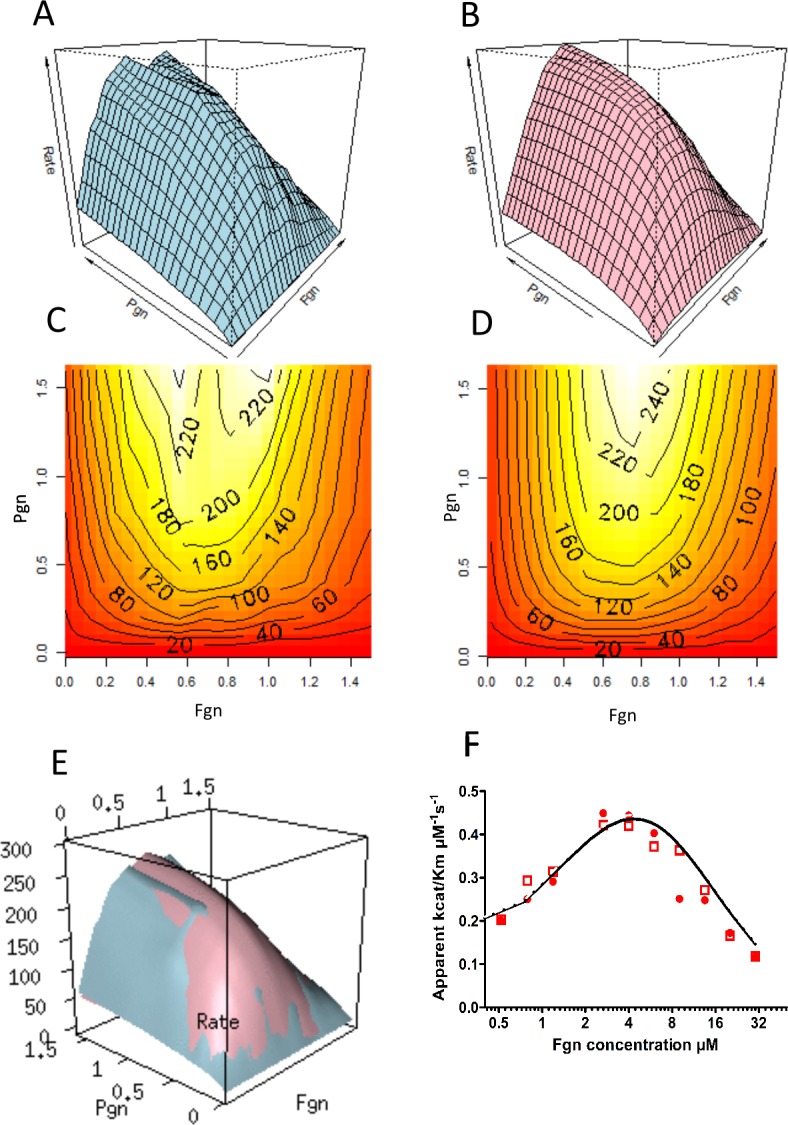
Fig 3. Comparison of Pgn activation data and simulated data for rSK-M1GAS over a range of Pgn and Fgn concentrations.

Panels A (experimental data) and C (simulated data) show fitted surface plots of rate of Pm generation plotted against Fgn and Pgn concentrations as shown, for 1.6 nM rSK-M1GAS. Panels B and D present the same results as a surface and contour plots giving rates of Pm production in pM/s against Pgn concentration (0–1.6 μM) and Fgn concentration (log scale for 0–30 μM). Panel E is an overlay of surfaces for the data and simulation shown in panels A and B. Experimental data using rSK-M1GAS at 1.6 (closed circles) and 0.4 nM (open squares) over a range of Pgn concentrations were fitted to the Michaelis-Menten equation to determine kcat and KM values, and calculate kcat/ KM at each Fgn concentration and this is shown in panel F. The solid line is for the same values calculated from simulated data using the same ranges of Pgn and Fgn (the lines overlap for 2 hypothetical rSK-M1GAS concentrations of 1.6 and 0.4 nM. R scripts and data files are provided in Supporting Information.
