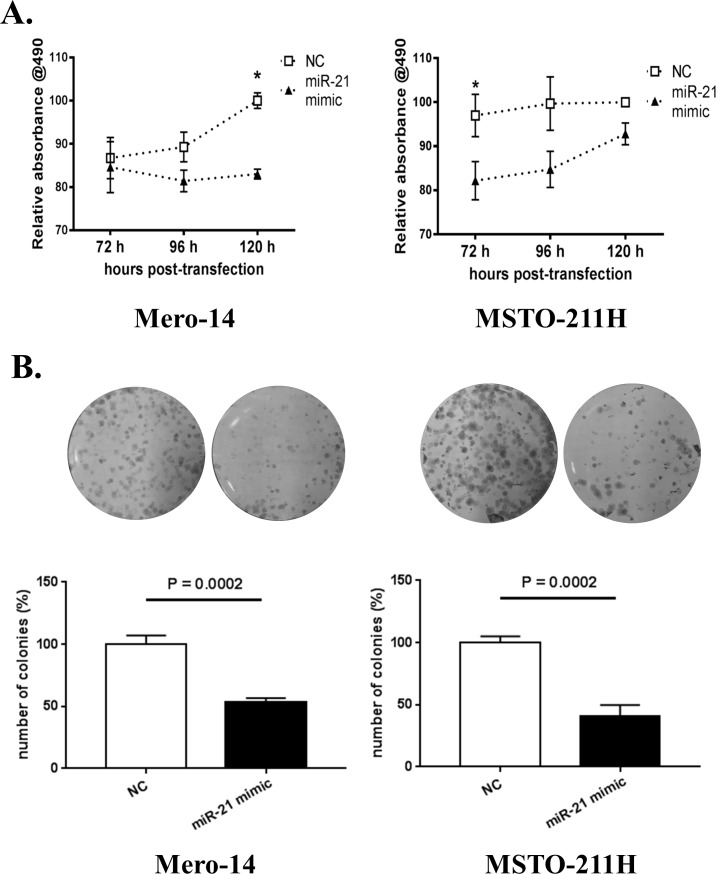
Fig 4. Functional assays on miR-21-5p-transfected MPM cell lines.
The columns represent mean values, the bars show SEM of three independent experiments. (A) SRB proliferation assay in Mero-14 (left) and MSTO-211H (right) treated with 30 nM of miR-21-5p mimic or negative control mimic. Asterisk (*) indicates P < 0.05 according to Bonferroni multiple comparison test within the mANOVA model. (B) Clonogenic assay: representative image of colonies formed by negative control (NC) or miR-21-5p transfected (100 nM) Mero-14 (left) and MSTO-211H (right) cell lines. The number of colonies is reported in % compared to the average of the three wells transfected with negative control in each experiment. The P-value according to Student’s t-test is reported.

