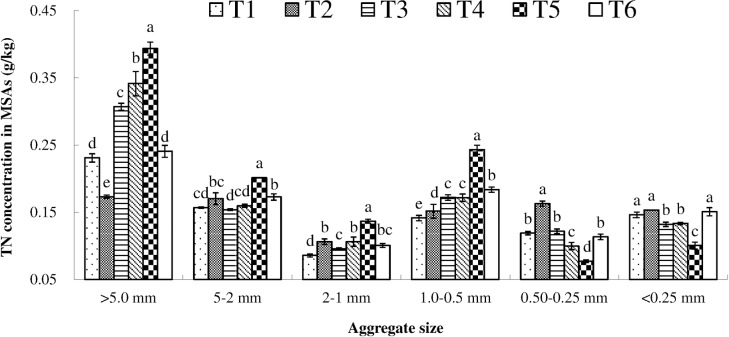
Fig 4. TN concentration in MSAs under different treatments.
Soil samples were collected at a depth of 0–20 cm after two years combined application of biogas slurry (BS) plus chemical fertilizer (CF). TN, total nitrogen (g/kg); MSAs: mechanical—stable aggregates. T1: control (no BS or CF); T2: CF only; T3: 15% BS—TN plus 85% CF—TN, T4: 30% BS—TN plus 70% CF—TN; T5: 45% BS—TN plus 55% CF—TN; and T6: BS only. Values were mean (n = 3). vertical bars in the figures represent the standard deviation of mean (n = 3) and lower case letters indicate significant differences between treatments at the P < 0.05 level (LSD test). ANOVA source information is shown in S6 Table.

