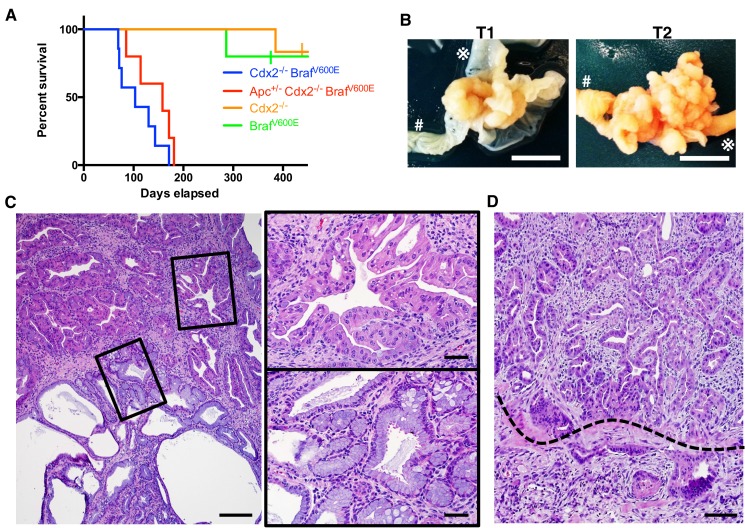
Figure 2. Characteristics of CDX2P-CreERT2 Cdx2fl/fl BrafCA mice.
(A) Kaplan-Meier curves of CDX2P-CreERT2 Cdx2fl/fl BrafCA (Cdx2-/- BrafV600E, n = 7), CDX2P-CreERT2 Apcfl/+Cdx2fl/fl BrafCA (Apc+/- Cdx2-/- BrafV600E, n = 5), CDX2P-CreERT2 Cdx2fl/fl (Cdx2-/-, n = 6), and CDX2P-CreERT2 BrafCA (BrafV600E, n = 5) mice, after two daily doses of TAM (150 mg/kg). p<0.002 when comparing Cdx2-/- or BrafV600E to Cdx2-/- BrafV600E or Apc+/- Cdx2-/- BrafV600E by log-rank test; p=0.158 when comparing Cdx2-/- BrafV600E to Apc+/- Cdx2-/- BrafV600E by log-rank test. (B) Macroscopic image of the tumors at the proximal colon-cecum-ileum junction of CDX2P-CreERT2 Cdx2fl/fl BrafCA mice. Left: protuberant tumor (T1) located at the proximal colon-cecum-ileum junction; Right: polypoid lesions (T2) that occupied at the entire terminal ileum to cecum region. # indicates the proximal colon;  indicates the ileum. Scale bar, 10 mm (C) Histological features of the proximal colon-cecum-ileum junction tumor of CDX2P-CreERT2Cdx2fl/fl BrafCA mice. Two major components were found in the tumor: serrated region (upper right) and mucin-rich region (lower left). Scale bars, 200 μm for low magnification image (left); 50 μm for high magnification images (right). (D) Serrated region showing invasion into submucosa. Dashed-line highlights muscular mucosa. Scale bar, 100 μm. See also Figure 2—source data 1 for panel A.
DOI: http://dx.doi.org/10.7554/eLife.20331.007


