
Figure 2.
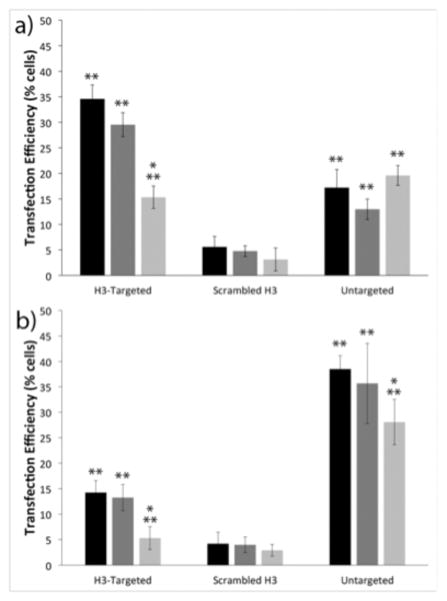
Flow cytometry analyses of cell transfection. Transfection efficiencies of the indicated polyplexes in (a) IBC SUM149 cells and (b) MCF10A cells. Transfection with no treatment control (black), scrambled siRNA (dark gray), and caveolin-1 siRNA (light gray). Each data point represents the mean ± standard deviation for a total of at least four separately prepared samples. * indicates statistically significant difference from the no treatment control (P < 0.05). ** indicates statistically significant difference between cell lines for each treatment (P < 0.05).