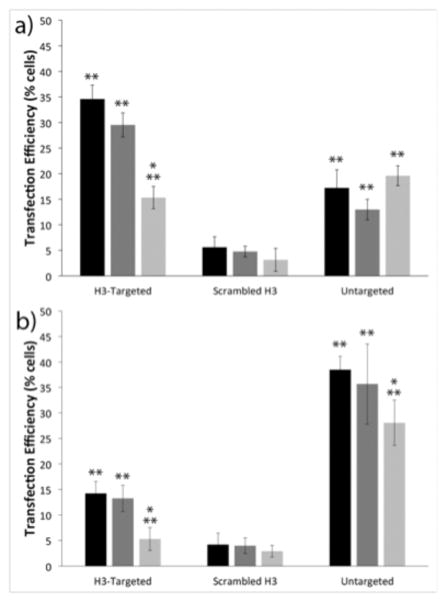
Figure 3.

Quantification of colocalization of H3-targeted (a,b) and untargeted (c,d) polyplexes with (a,c) Rab6 and (b,d) Rab11 at four different time points following a pulse transfection in MCF10A (light gray) and IBC SUM149 (dark gray) cells. Quantification of colocalization from confocal microscopy images was performed with Volocity Image Analysis software. Each data point represents the mean ± SE for a minimum of 100 polyplexes, with ~10 images analyzed per colocalization replicate. Gray box indicates mitosis. * indicates statistically significant difference between cell line (P < 0.05). ** indicates statistically significant difference from previous time point (P < 0.05).
