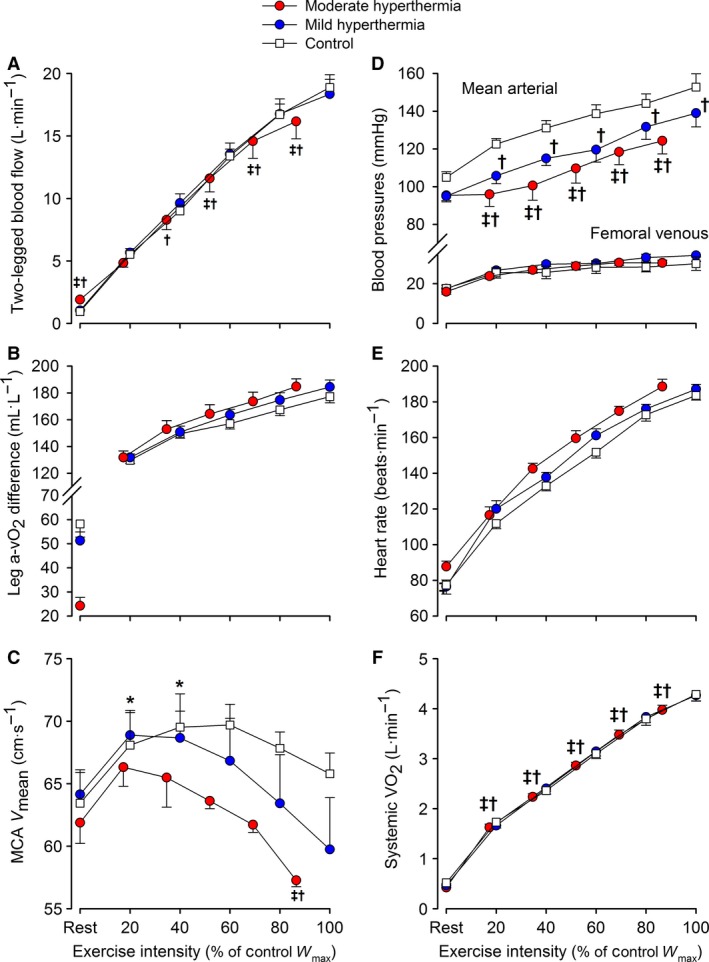
Figure 4.

Two‐legged and brain hemodynamics, blood pressures and systemic oxygen uptake in response to exercise with different grades of hyperthermia. Values are means ± SEM for nine participants. Variables in all figures (except Fig. 4C) increased with exercise intensity. Limb blood flow (Fig. 4A) increased with exercise intensity to ~80% W max (P < 0.05), but plateaued prior to exhaustion. ‡different versus mild hyperthermia, †different versus control. Presented symbols denote differences between conditions, when compared at a relative % of maximal work rate in hyperthermia or normothermia (100% = 321 W in HYP mod vs. 371 W in HYP mild and control, respectively).
