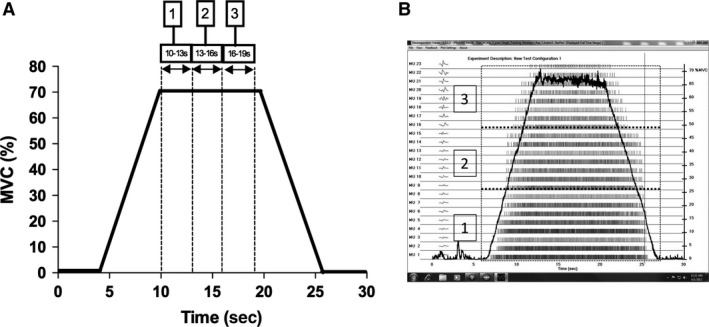
Figure 1.

(A) Concentric knee extension isometric trapezoid force trace (MVC%) with 3 plateau phase time periods in which motor unit firing (MUFR) analysis was conducted. (B) Firing rate bar plot. Vertical lines represent the firings of each motor unit and the black line indicates the force trace. The red broken line boxes denote the three identified motor unit populations used for analysis; (1) early‐recruited; (2) mid‐recruited; and (3) later‐recruited motor units. MUFT, motor unit firing rate.
