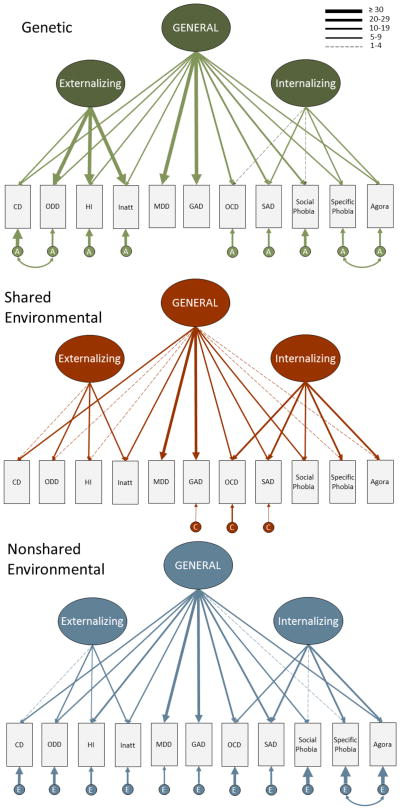
Figure 3.
Variance components from the best-fitting common pathways model from twin analyses of combined parent and youth ratings of 11 dimensions of psychopathology in 9–17 year old children and adolescents in the Tennessee Twin Study (Lahey, Rathouz, et al., 2008) indicating the estimated proportion of phenotypic variance in each of the dimensions explained by shared and dimension-specific additive genetic, shared environmental, and nonshared environmental influences from each higher-order factor. The magnitude each variance component is proportional to the width of the connecting arrow.

