
Figure 1.
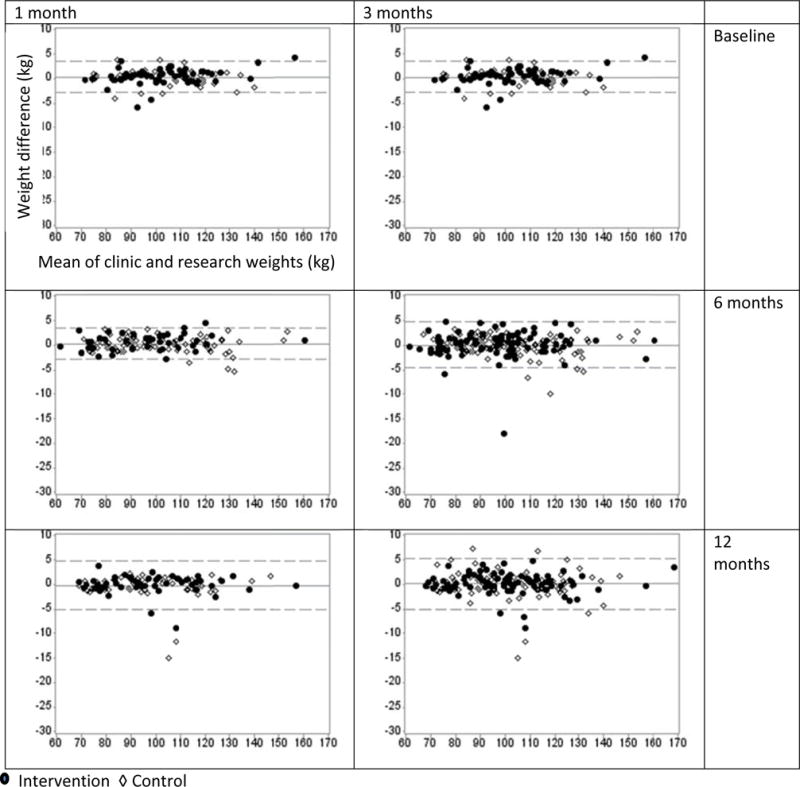
Bland and Altman’s limits of agreement plots. The plots illustrate the differences between clinic and research weights (y-axis, in kg) and the lower and upper bounds for the 95% limits of agreement (horizontal dashed lines, mean of differences ± 1.96 standard deviation) against the means of these measurements (x-axis, in kg) in the BE WELL trial. Two index windows, 1 and 3 months, were applied to capture the closest clinic weight in time in comparison to research weights measured at baseline, 6 and 12 months.