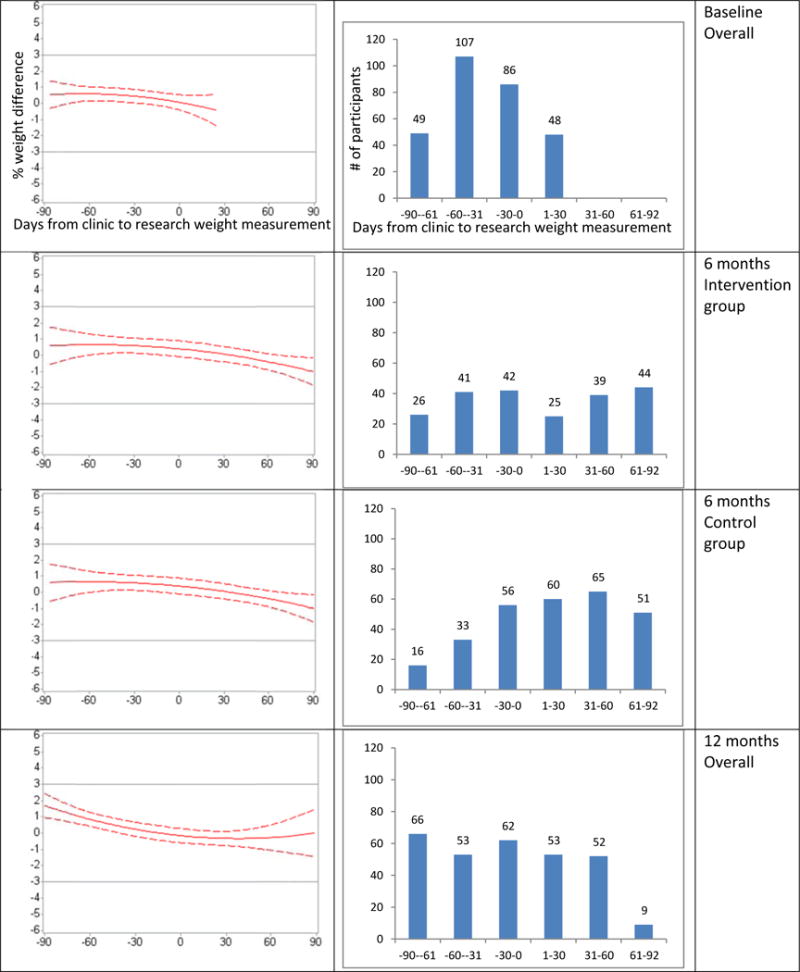
Figure 2.

Polynomial regression model results. The graphs show the predicted percentage weight differences, (clinic weight-research weight)/research weight, in kg, and the 95% CIs (left) or the numbers of participants with available clinic and research weight (right) versus days between clinic and research weight measurements by study time point. The coefficients for the treatment group-by-days interaction term were not statistically significant at baseline and 12 months. Thus, separate regression lines by treatment group are shown at 6 months only.
