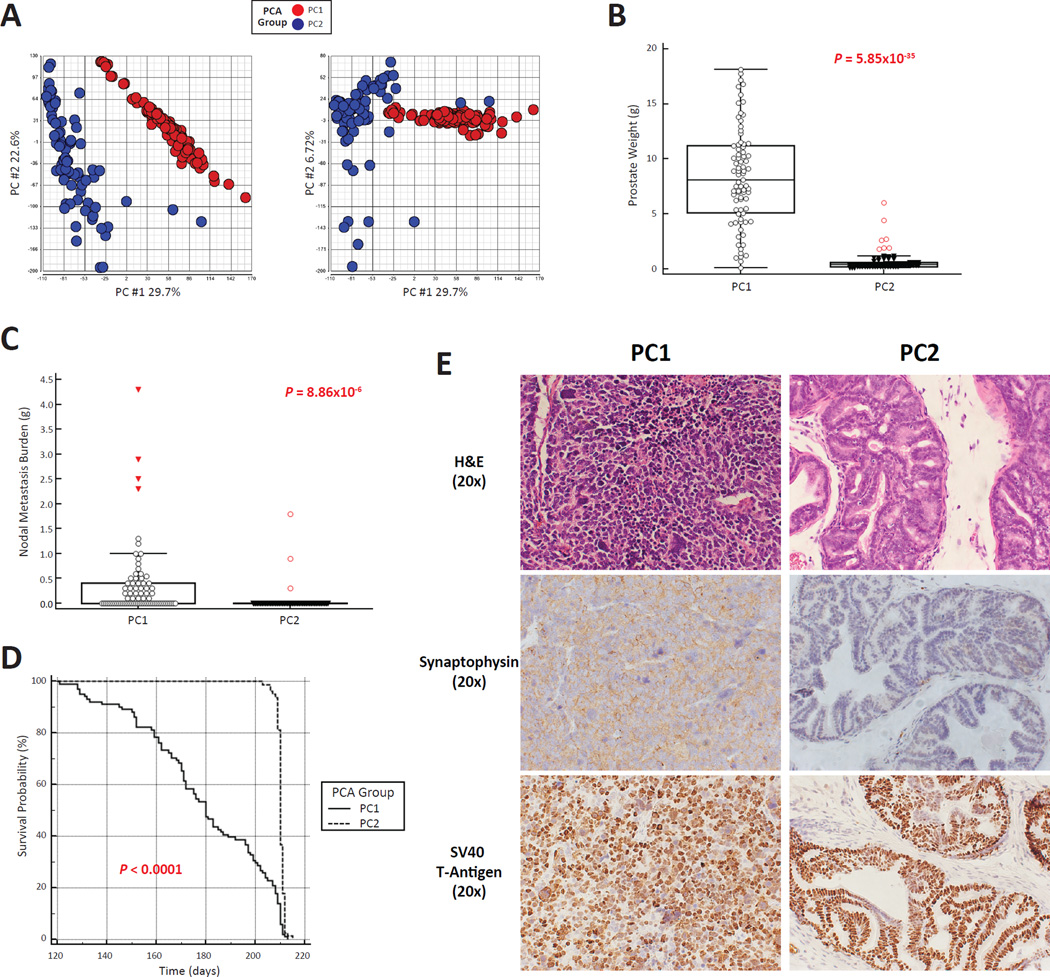
Figure 2.
RNA-Seq analysis of 195 (TRAMP × J:DO) F1 tumors reveals two distinct patterns of gene expression. A) Principal component analysis of global patterns of sub-divided tumor gene expression in two distinct groups (PC1 [red] & PC2 [blue]) when comparing PC1 vs. PC2 and PC1 vs. PC3. B) PC1 tumors were significantly larger than PC2 tumors (mean ± SD). C) Metastasis burden to regional lymph nodes was significantly more frequent in PC1 compared to PC2 mice (mean ± SD). D) Animals were aged to 210 days or humane end points. PC1 animals had a significantly earlier age at euthanasia compared to PC2 animals. E) H&E staining of representative PC1 and PC2 prostates at the experimental endpoint (210 days) revealed an anaplastic histological appearance indicative of NE tumorigenesis in PC1 tumors (upper right panel) and benign, atypical hyperplasia of Tag in PC2 prostates (upper left panel). IHC analysis revealed strong staining of endpoint PC1 tumors for the NE maker Synaptophysin (middle left panel) with low levels of this NE marker observed in endpoint PC2 prostates (middle right panel). Finally, IHC analysis of SV40-T antigen expression in endpoint PC1 and PC2 prostates (lower left and right panels, respectively) revealed equal levels of nuclear transgene expression (20X optical magnification).

