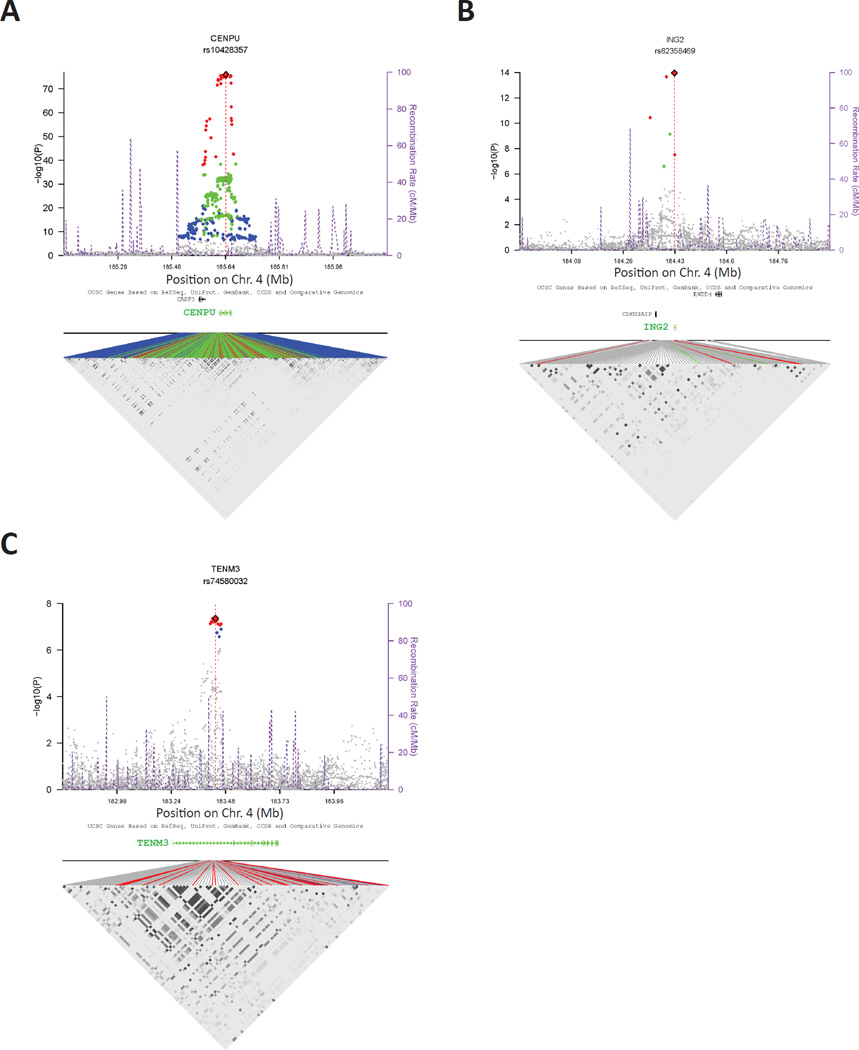
Figure 3.
Regional association plots for aggressive prostate cancer candidate susceptibility genes with statistically significant cis-eQTLs. Cis-eQTLs in normal prostates derived from a cohort of 471 men are shown for A) CENPU, B) ING2, and C) TENM3. In each instance, the peak cis-eQTL SNP is marked as a red diamond. All SNPs reaching the Bonferroni are colored according to LD with the peak SNP (red: r2 > 0.5; green: [0.5, 0.2]; blue: < 0.2). The purple dotted lines represent recombination rates and positions. A LD heat map for significant regional SNPs is shown in the bottom part of each panel. The points are colored as above to signify LD with the peak cis-eQTL SNP. Also see Fig. S4.

