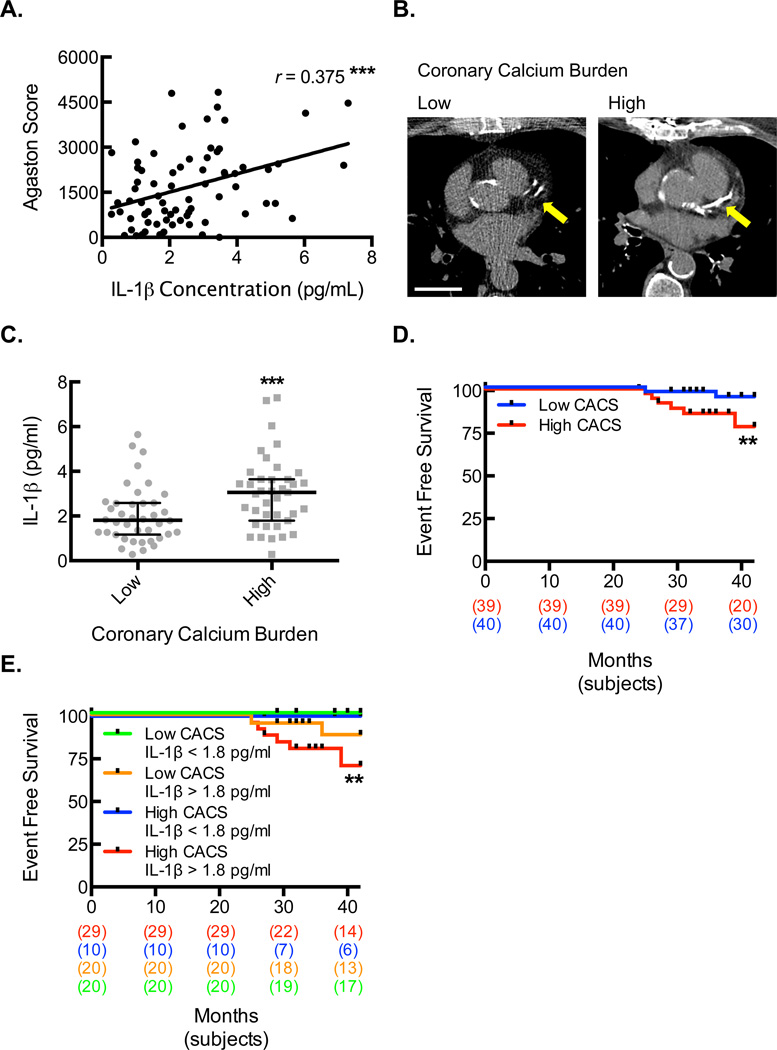
Figure 7. Increased serum IL-1β level is associated with higher coronary calcium burden and is predictive of cardiovascular outcomes in patients.
(A) The Pearson correlation between IL-1β protein concentrations and CACS (***, P=0.001; n=79). (B) Noncontrast CT scan images illustrating the LAD territory calcification in coronary disease patients who were divided by CACS into low and high calcium burden groups. Bar, 3 cm. (C) Serum IL-1β protein concentrations for each patient (gray dots) along with median and interquartile ranges within each level of calcium burden (***, P=0.0040; n=39–40). (D) Kaplan-Meier event curve for hard cardiac events of sudden cardiac death, myocardial infarction, and acute coronary syndrome in patients divided by calcium burden (**, P=0.0259, n=39–40, long-rank test). (E) Kaplan-Meier event curve for hard cardiac events of sudden cardiac death, myocardial infarction, and acute coronary syndrome in patients divided by both calcium burden and serum IL-1β concentration (**, P=0.0119, n=10–28, long-rank test).

