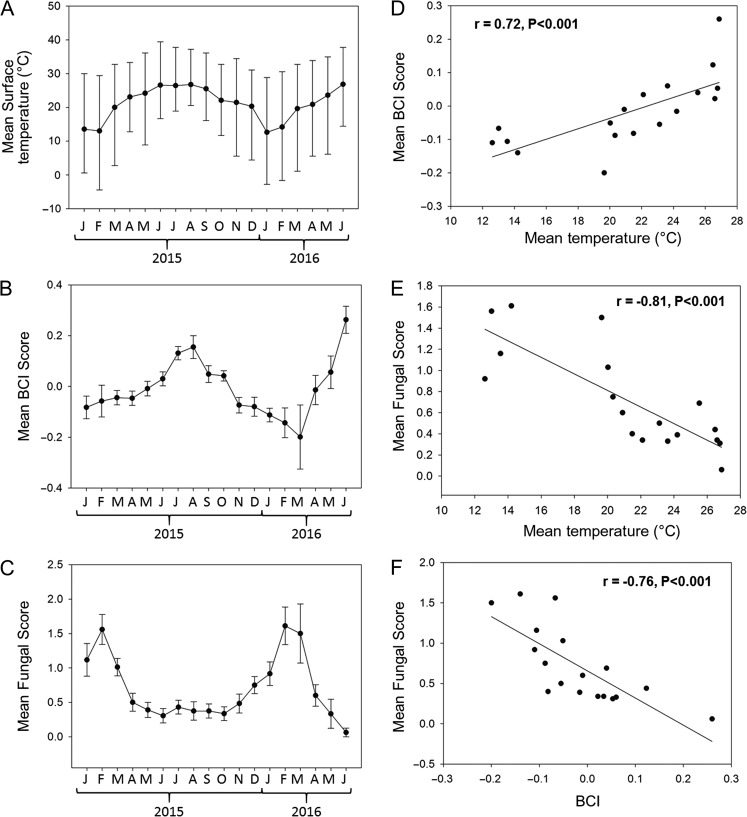
Figure 2:
Monthly mean surface air temperature (A), body condition index (BCI; B) and snake fungal disease (SFD) score (C) for all 18 months of the study. Bars above and below means in A represent monthly minimal and maximal surface temperature. Bars in B and C represent the SEM. Linear correlations among the three variables are shown in D–F. Results of Pearson correlations are provided at the top of each graph.

