
Fig. 2. Protein co-expression classifies the proteome into modules associated with specific gene ontologies and brain cell types.
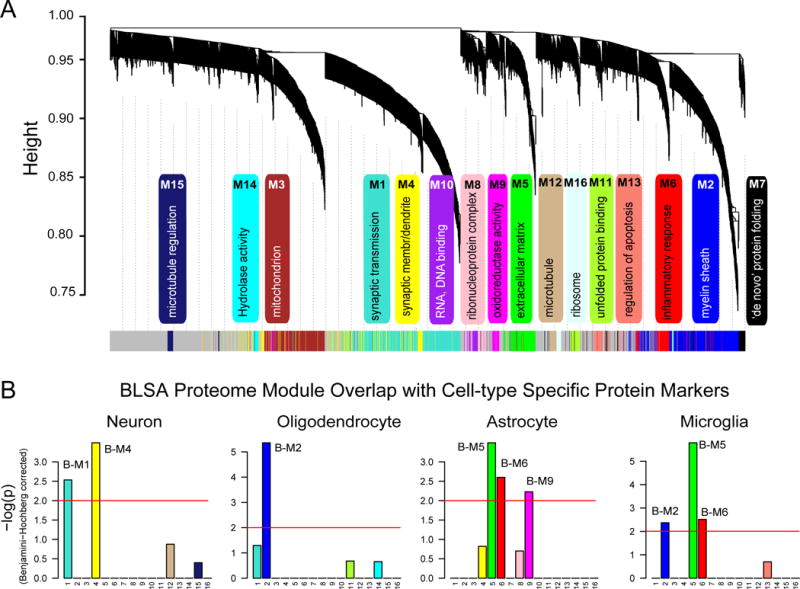
(A) WGCNA cluster dendrogram groups proteins (n=2,735) measured across FC and PC into distinct protein modules (M1–16) defined by dendrogram branch cutting. These modules were significantly enriched for gene ontologies linked to discrete cellular functions and/or organelles in the brain. (B) Cell type enrichment was assessed by cross-referencing module proteins (via matching gene symbols) using the one-tailed Fisher’s exact test against lists of proteins determined as enriched in neurons, oligodendrocytes, astrocytes and microglia (Table S4). The FDR was corrected for multiple comparisons by the Benjamini-Hochberg (BH) method, bars extending above the line represent BH p<0.01.