Figure 1.
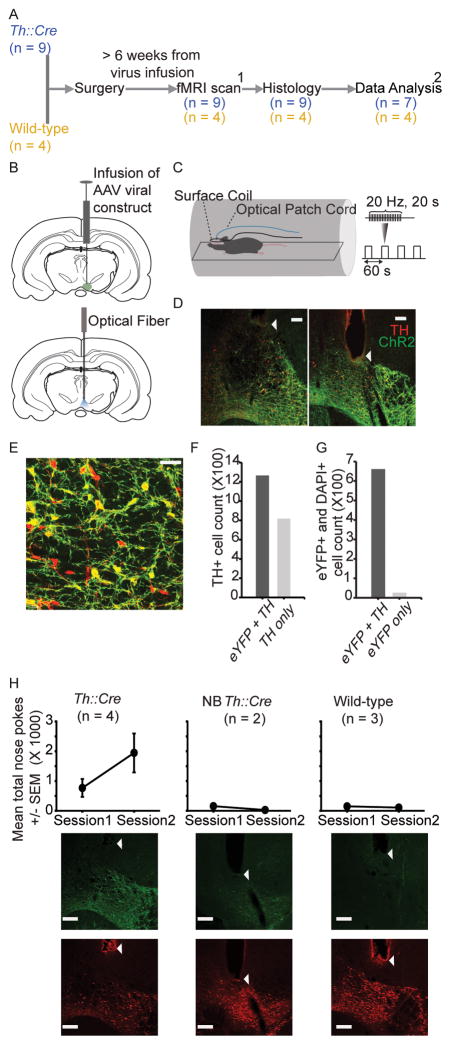
Experimental design, histology and behavior. (A) Experimental design. 1 A subset of rats (6 Th::Cre and 3 wild-type) were characterized behaviorally in an intra-cranial self-stimulation (ICSS) task prior to fMRI scanning. 2 Two Th::Cre rats were excluded from the Th::Cre group fMRI data analysis due to low levels of ChR2 integration in VTA and weak expression of ICSS behavior (also see Figure 1H). (B) Schematic demonstrating infusion of AAV viral construct and implantation of an optical fiber in right VTA. (C) fMRI setup. Each fMRI run consisted of 5 s of baseline followed by 4 optical stimulation trials. In each trial, blue laser pulses were delivered to VTA at 20 Hz (5 ms width, power = 2.5 – 7.5 mW, 473 nm) for 20 s, followed by 40 s of rest. (D) Representative histological images from two Th::Cre rats showing ChR2 expression and implanted fiber tips (white arrowheads) in VTA. Scale bar: 130 μm. (E) Expression of ChR2-eYFP (green) in TH+ (red) neurons in VTA of Th::Cre rats. Scale bar: 40 μm. (F) Quantification of TH+ cell bodies (n = 2083 cells from 7 Th::Cre rats) that also express eYFP in VTA (measure of sensitivity of ChR2-eYFP expression). (G) Quantification of VTA cell bodies immunopositive for both eYFP and DAPI (n = 687 cells from 4 Th::Cre rats) that also express TH in VTA (measure of specificity of ChR2-eYFP expression). (H) (Top) ICSS behavior. Rats executed nose pokes to receive optical VTA stimulation (20 Hz, 5 ms pulse width, power = 5 – 8 mW, 473 nm). The average total number of nose pokes executed per session by Th::Cre, “behaviorally non-responsive” Th::Cre (NB Th::Cre) and wild-type rats is shown. (Bottom) Representative histological images show a differential amount of ChR2 (green fluorescence, top row) expression directly below the optical fiber tips in VTA of Th::Cre, NB Th::Cre, and wild-type rats. The bottom row shows TH expression in images acquired in the same field of view as the ChR2 images (top row). All images corresponding to a particular fluorescence stain (ChR2 or TH) were acquired using the same parameters, and white arrowheads point to optical fiber tips. Scale bars: 200 μm.

