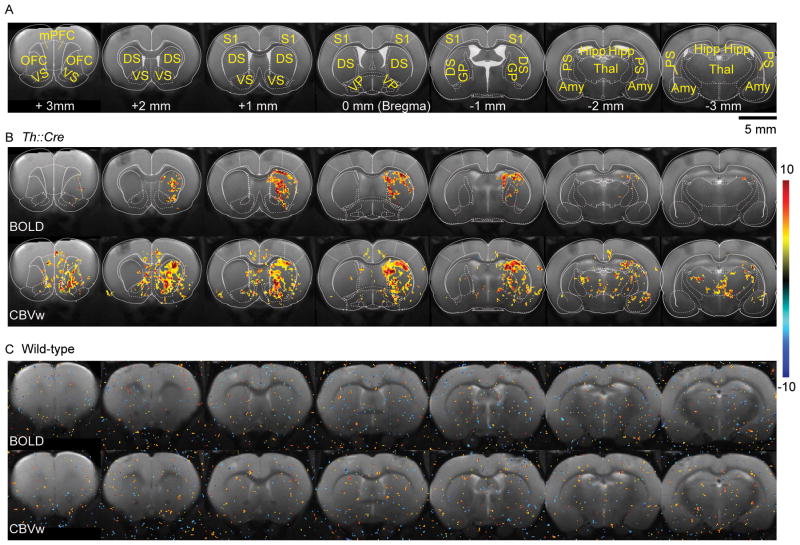
Figure 2.
Group activation maps. (A) Atlas figures overlaid on structural images to delineate regions-of-interest (ROIs) (mPFC = medial prefrontal cortex; OFC = orbitofrontal cortex; DS = dorsal striatum; VS = ventral striatum; S1 = primary somatosensory cortex; VP = ventral pallidum; GP = globus pallidus; Hipp = hippocampus; Amy = amygdala; Thal = thalamus; PS = posterior striatum). (B) Statistical t-value maps overlaid on structural images illustrate increased BOLD and CBVw activity in the striatum and other ROIs after optical VTA stimulation in Th::Cre rats (n = 5 for BOLD and n = 6 for CBVw). Note that positive CBVw t-values represent blood volume increases during stimulation. Atlas overlays (same as A) mark the boundaries of ROIs. Voxel-wise and family-wise error correction (cluster size > 28 voxels) thresholds were set to p < 0.025. (See Supplementary Figure 2 for group maps with different thresholds) (C) Wild-type (n = 4 for BOLD and CBVw) rats do not exhibit any increase in BOLD and CBVw activity in the whole brain even at a low threshold (voxel-level p < 0.025 and cluster size > 0 voxels) upon optical VTA stimulation. Color bar indicates t-values. Voxel size: 125 μm × 125 μm × 1 mm.

