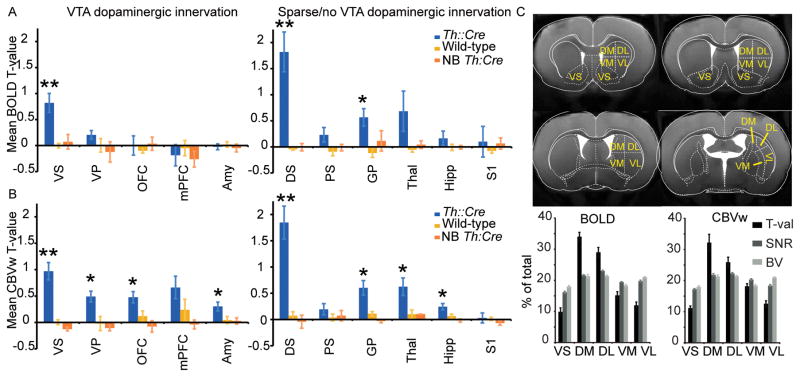
Figure 3.
Ipsilateral ROI analysis (see Supplementary Figure 4 for contralateral ROI analysis). Mean ± SEM t-values for correlation of (A) BOLD and (B) CBVw signal changes within ROIs with predicted hemodynamic response functions. Right hemisphere ROIs were drawn on individual structural images for Th::Cre rats (n = 5 for BOLD and n = 7 for CBVw), NB Th::Cre rats (n = 2 for BOLD and CBVw), and wild-type rats (n = 4 for BOLD and CBVw). Brown-Forsythe ANOVAs yielded significant differences in activation t-values for BOLD in the following ROIs: VS (F(2,8) = 13.569, p = 0.008), DS (F(2,8) = 23.017, p = 0.006), and GP (F(2,8) = 6.843, p = 0.043) and for CBVw in the following structures: VS (F(2,10) = 34.546, p = 0.000), VP (F(2, 10) = 10.625, p = 0.006), OFC (F(2,10) = 7.4555, p = 0.015), amygdala (F(2,10) = 5.489, p = 0.025), DS (F(2, 10) = 29.262, p = 0.000), GP (F(2,10) = 14.061, p = 0.003), thalamus (F(2,10) = 8.131, p = 0.012), and hippocampus (F(2,10) = 8.624, p = 0.007). Post-hoc two sample t-tests resulted in significant differences in BOLD t-values between Th::Cre and wild-type rats in these ROIs: VS (t(7) = 4.376, p = 0.009), DS (t(7) = 4.879, p = 0.008), and GP (t(7) = 3.643, p = 0.012). CBVw t-values were significantly different between Th::Cre and wild-type rats in these ROIs: VS (t(9) = 5.639, p = 0.001), VP (t(9) = 3.013, p = 0.021), OFC (t(9) = 2.460, p = 0.038), amygdala (t(9) = 2.409, p = 0.040), DS (t(9) = 5.472, p = 0.001), GP (t(9) =3.397; p = 0.012), thalamus (t(9) = 2.817, p = 0.022), and hippocampus (t(9) = 2.523, p = 0.033). There was no significant difference between NB Th::Cre and wild-type groups for any ROI. * = p < 0.05, ** = p < 0.01. (C) DS of Th::Cre rats was divided into four quadrants (DM = dorsomedial, DL = dorsolateral, VM = ventromedial, and VL = ventrolateral) as indicated in the anatomical images with overlaid atlas figures (top). BOLD and CBVw t-values, BOLD and CBVw baseline signal-to-noise ratio (SNR), and baseline blood volume (BV) were expressed as percentages of summed total values across the five subdivisions of striatum, including VS (bottom). One-way repeated measures ANOVAs yielded significant differences among sub-divisions of the striatum in relative activation t-values for BOLD (F(4, 16) = 53.067, p = 0.000, n = 5 rats) and CBVw (F(4, 24) = 26.913, p = 0.000, n = 7 rats, Greenhouse-Geisser corrected) contrasts. Repeated measures ANOVAs also resulted in significant differences among striatal subdivisions in relative BV (F(4, 24) = 16.623, p = 0.000, n = 7 rats) and relative SNR for BOLD (F (4, 16) =76.71, p =0.000, n = 5 rats) and CBVw (F(4, 24) = 37.34, p = 0.000, n = 7 rats) contrasts.

