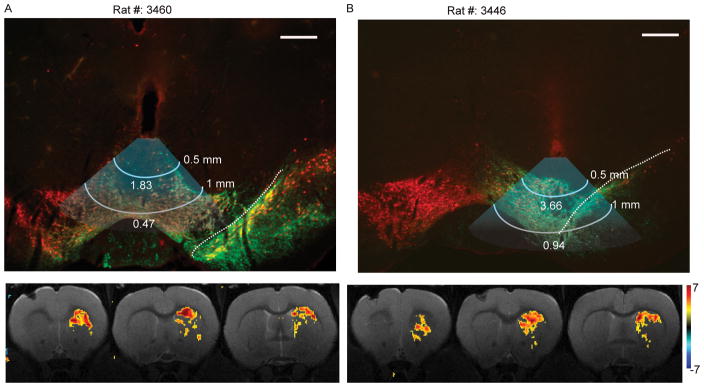
Figure 4.
Individual histology and activation maps. (Top) Schematics of approximate spread of blue light in the VTA and SN are overlaid on immunohistological images (red: TH, green: ChR2-eYFP) that show optical fiber tips at locations farthest from SN (A) and closest to SN (B). The predicted irradiance values (mW/mm2) calculated using the online irradiance calculator (http://www.stanford.edu/group/dlab/cgi-bin/graph/chart.php) are indicated for distances of 0.5 mm (first white line) and 1 mm (second white line) from the optical fiber tips. Scale bar: 0.5 mm. Dashed white lines mark the approximate boundary between VTA and SN. (Bottom) CBVw t-value statistical maps for two rats (A and B) illustrate individual responses in the striatum to VTA optical stimulation. Voxel-wise and family-wise error correction (cluster size > 19 voxels) thresholds were set to p < 0.01. Color bar: t-values.

