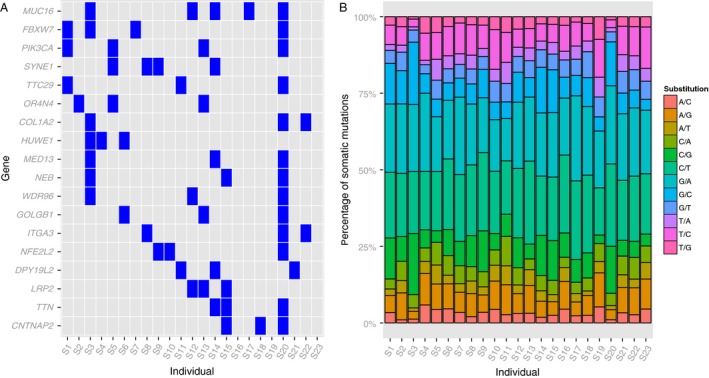
Figure 1.

Distribution of mutated genes and base substitution patterns in the 23 patients with cervical cancer. (A) Distribution of mutated genes in at least three patients (mutation frequency > 13%). Each column represents one individual, and each row is a gene. (B) Distribution of base substitution patterns for all somatic mutations.
