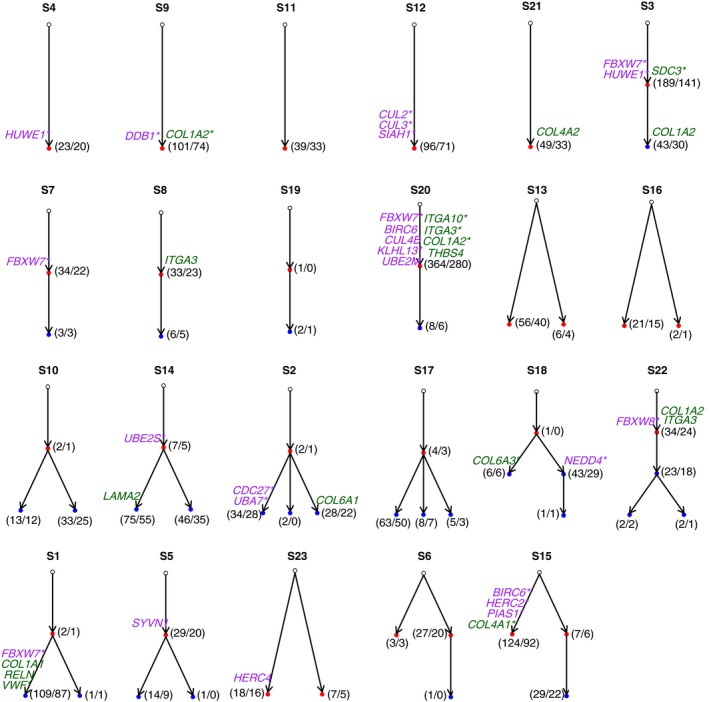
Figure 3.

The clonal structures and phylogenic relationships for all 23 patients. In each patient, a phylogenic tree was constructed using somatic mutations. Each node represents one clone. Each clone harbors multiple mutations, and only the genes involved in the ubiquitin‐mediated proteolysis (purple) and ECM receptor interaction (dark green) pathways are labeled on the corresponding node. Normal clones (non‐pathogenic) are in open circles, early clones are shown in red, and later clones are shown in blue. Arrows point from the parent node to the child node (i.e., the descendant clone derived from the ancestor clone). Asterisks indicate that the gene harbors putative neo‐epitopes. The numbers in parentheses indicate the number of total mutated genes (before the slash) and the number of genes that harbored putative neo‐epitopes in the clone.
