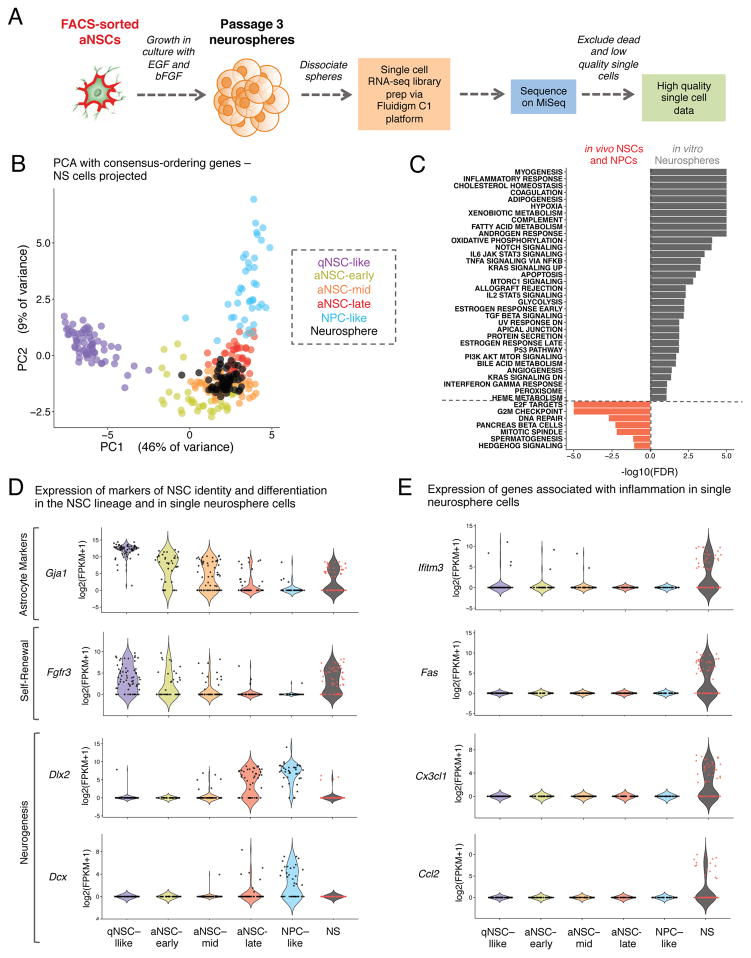
Figure 5. In the spectrum of NSC activation and differentiation in vivo, in vitro cultured NSCs resemble aNSCs but exhibit a signature of inflammation.
(A) Preparation of single cell RNA-sequencing libraries from passage 3 neurospheres (NS) derived from FACS-sorted aNSCs.
(B) PCA with qNSCs, aNSCs, and NPCs using expression [log2(FPKM+1)] of the consensus-ordering genes from machine learning models (Table S7A). NS single cells are projected onto the resulting principal component space. Cells are colored by identity defined in Figure 2G and NS single cells are black.
(C) Gene-set enrichments for genes ranked by Z-score for differential expression between single NS cells and in vivo aNSCs and NPCs. Enrichments expressed as [−log10(FDR)] and directionality and color indicate the intermediate state in which the gene set is enriched (FDR<0.2).
(D) Expression of genes associated with astrocyte identity, self-renewal, and neurogenesis in in vitro NS single cells and in vivo NSCs. Violin plots showing gene expression in the cellular states defined in Figure 2G as well as in NS single cells.
(E) Expression of genes associated with inflammatory signatures in single NS cells and in vivo NSCs. Data presented as in Figure 5D.

