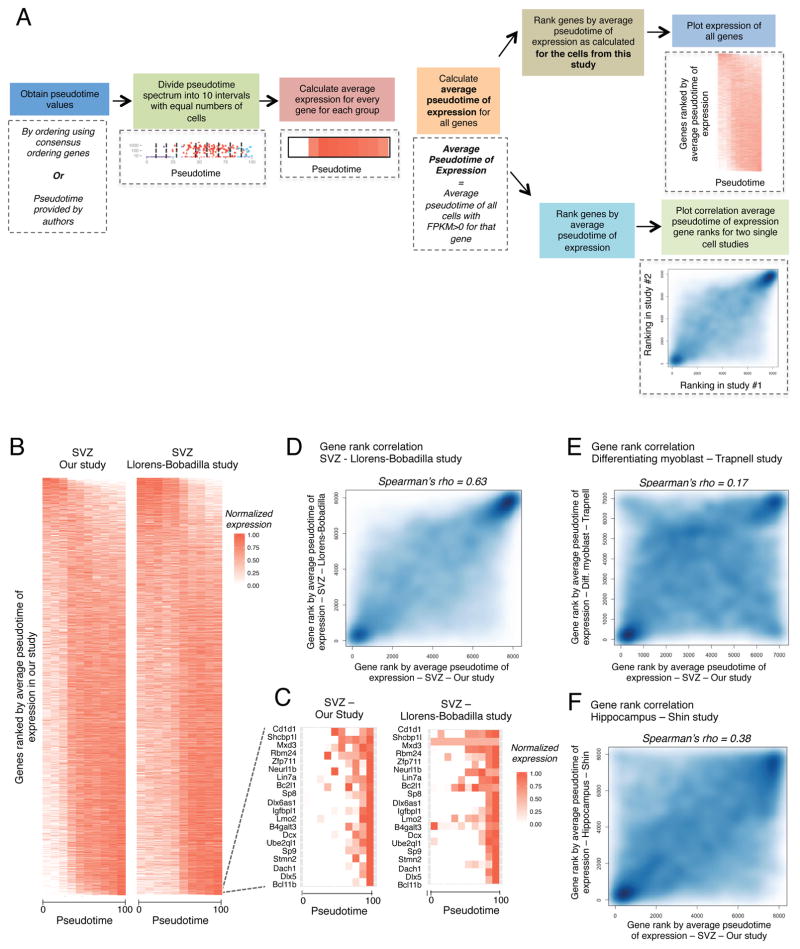
Figure 7. Meta-analysis to compare global pseudotime-dependent gene expression in various single cell datasets.
(A) Schematic outlining the approaches for generating pseudotime expression heatmaps and for correlating gene rankings by average pseudotime of expression (APE, see Supplemental Experimental Methods) for different single cell datasets.
(B) Heatmap representing the expression of all detected genes ranked by APE defined in our study. Expression plotted as a function of pseudotime. Left panel: expression from our study (qNSCs, aNSCs, and NPCs), pseudotime defined by Monocle ordering using consensus-ordering genes identified by machine learning (Table S7A). Right panel: expression from the Llorens-Bobadilla study (NSCs and TAPs), pseudotime defined by Monocle ordering using consensus-ordering genes (Table S7A).
(C) Heatmap representing expression of the 20 genes with highest values of APE (expressed most exclusively in NPCs) in our dataset. Left panel: expression from our study (qNSCs, aNSCs, and NPCs), pseudotime defined as in Figure 7B. Right panel: expression from the Llorens-Bobadilla study (NSCs and TAPs), pseudotime defined as in Figure 7B.
(D) Smooth scatter plot representing gene ranks by average pseudotime of expression (APE) in (x-axis) qNSCs, aNSCs, and NPCs from our study ordered by Monocle using the consensus-ordering genes identified by machine learning (Table S7A) and (y-axis) NSCs and TAPs from the Llorens-Bobadilla study ordered by Monocle using the consensus-ordering genes identified by machine learning (Table S7A) (Spearman’s rho = 0.63, p < 2.2e−16).
(E) Smooth scatter plot representing gene rankings by average pseudotime of expression (APE) in (x-axis) qNSCs, aNSCs, and NPCs from the current study ordered as in Figure 7D and (y-axis) differentiating myoblasts ordered by Monocle from (Trapnell et al., 2014) (Spearman’s rho = 0.17, p < 2.2e−16).
(F) Smooth scatter plot representing gene rankings by average pseudotime of expression (APE) in (x-axis) qNSCs, aNSCs, and NPCs from our study ordered as in Figure 7D and (y-axis) hippocampal NSCs ordered by Waterfall in the study by Shin and colleagues (Shin et al., 2015) (Spearman’s rho = 0.38, p < 2.2e−16).

