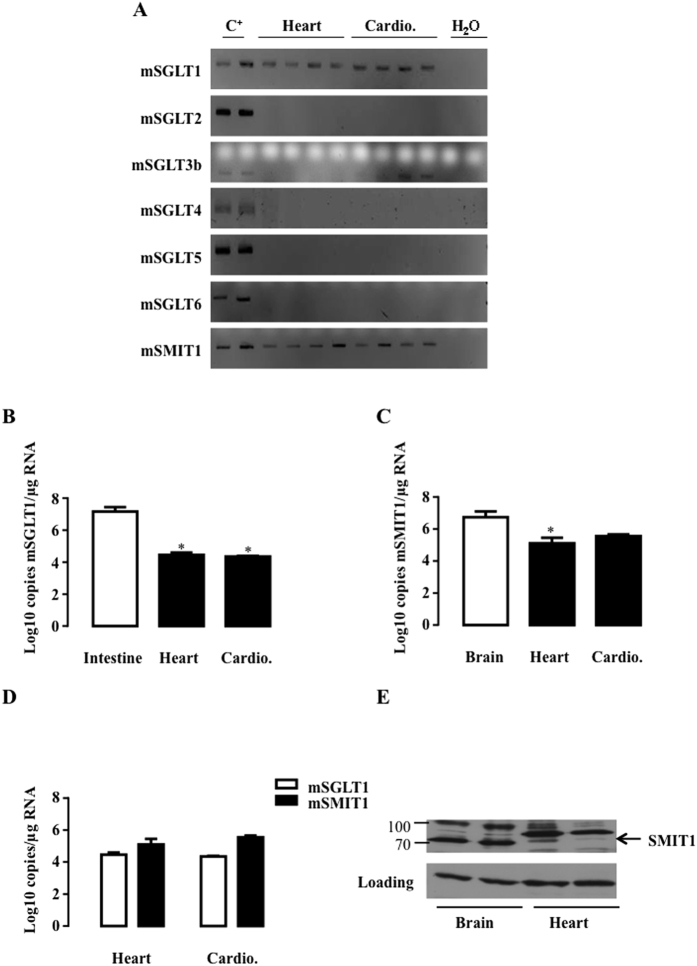
Figure 2. Detection of SGLT isoforms in mouse heart and cardiomyocytes.
(A) SGLT1, SGLT2, SGLT3b, SGLT4, SGLT5, SGLT6 and SMIT1 detection by RT-PCR and ethidium bromide-stained agarose gels on mRNA extracted from hearts (n = 4) and isolated cardiomyocytes (cardio. n = 4) of mice. Positive controls were intestine for SGLT1, kidney for SGLT2, SGLT3, SGLT4 and SGLT5 and brain for SGLT6 and SMIT1. mRNA copy number per μg of RNA of SGLT1 (B) and SMIT1 (C) were measured in mice hearts (n = 4) and cardiomyocytes (n = 4) and compared to a positive control (n = 3). Data are means ± SEM. Statistical analysis was by one-way ANOVA. *Indicates values statistically different from corresponding control tissue, p ≤ 0.05. (D) Comparison of SGLT1 and SMIT1 mRNA copy numbers/μg of RNA between hearts (n = 4) and cardiomyocytes (n = 4). Data were normalized to ribosomal protein L32 (RPL32) and expressed as Log10 copy numbers/μg RNA. (E) SMIT1 protein expression in murine heart compared to murine brain. eEF-2 detection is used as loading control. Full-length blots are presented in Supplementary Figure 5.

