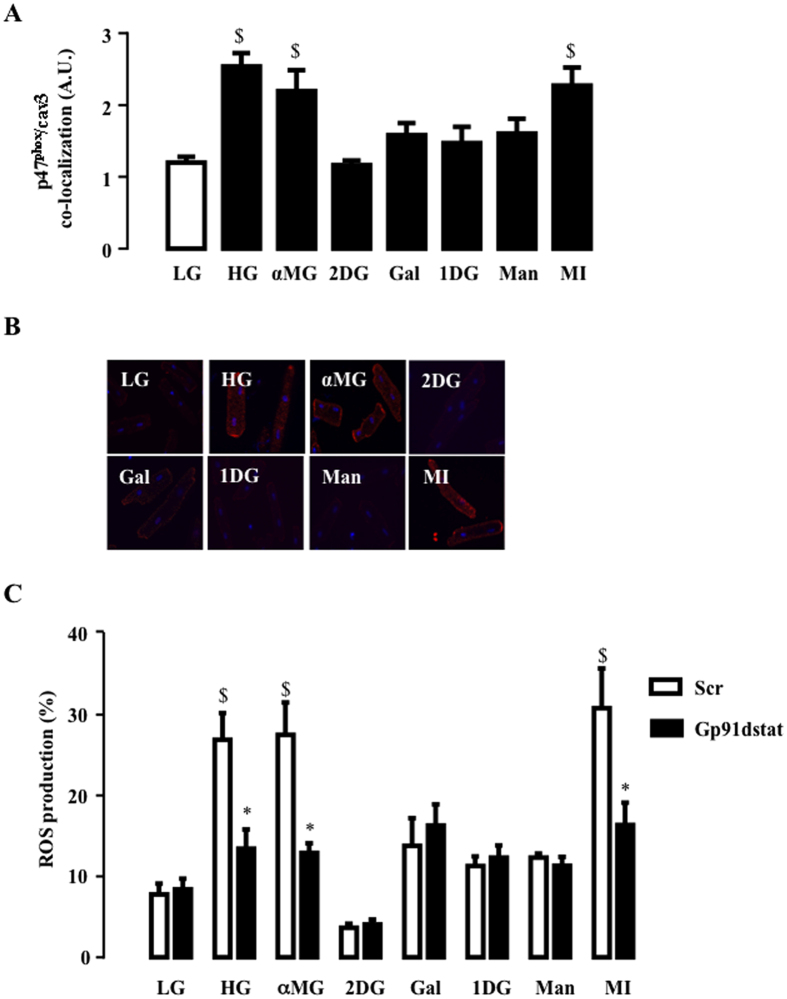
Figure 4. Effect of glucose analogues on NOX2 activation and ROS production.
(A) Effect of 5 mM (LG) or 16 mM of glucose (HG), α-Methyl-D-glucose (αMG), 2-deoxy-glucose (2DG), galactose (Gal), 1-deoxy-glucose (1DG), mannose (Man) or myo-inositol (MI) (under 5 mM glucose background) on HG-induced p47phox co-localization close to cav3. The close proximity between p47phox and cav3, as detected by PLA, was assessed 90 min after exposure to glucose analogues. Typical pictures of the effect of glucose analogues are shown in (B). White lines correspond to 20 μm. (C) ROS production measured 2 h after LG, HG, αMG, 2DG, Gal, 1DG, Man and MI. 2.5 μM of Gp91dstat or scrambled peptide were added 15 min before glucose analogues. The data are means ± SEM, (n = 4). Statistical analysis was by (A) one-way ANOVA and (C) two-way ANOVA. $Indicates values statistically different from LG, p ≤ 0.05. *Indicates values statistically different from the corresponding HG sample without treatment, p ≤ 0.05.

