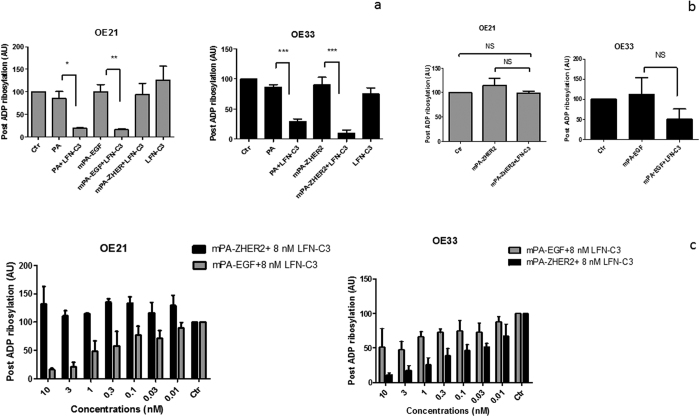
Figure 6.
Post-ADP-ribosylation of cell-lysates (a,b): OE21 cells and OE33 cells were treated with PA (10 nM), mPA-EGF (10 nM), mPA-ZHER2 (10 nM), LFN-C3 (8 nM) for 4 h, as indicated, washed and lysed. Lysates were than incubated with LFN-C3 in the presence of radio-labeled NAD+. Proteins of the lysates were separated by SDS-PAGE. Following drying of the gels labeled protein bands were detected by phosphorimaging and quantified. Labeled actin of an untreated control was set as 100%. Data give the median of three experiments plus standard deviation. Significance was analyzed using GraphPad Prism 5 (***p < 0,001, **p < 0,01, *p < 0,05). Post-ADP-ribosylation of cell-lysates following intoxication as dose response analysis (c): OE21 or OE33 cells were treated with increasing concentrations of mPA-EGF (gray, 0.01 nM to 10 nM) or mPA-ZHER2 (black, 0.01 nM to 10 nM) and a fixed concentration of LFN-C3 (8 nM) for 4 h, as indicated. Lysates were prepared and treated as in (a). For each experiment a representative Western blot is shown in Fig. S4.

