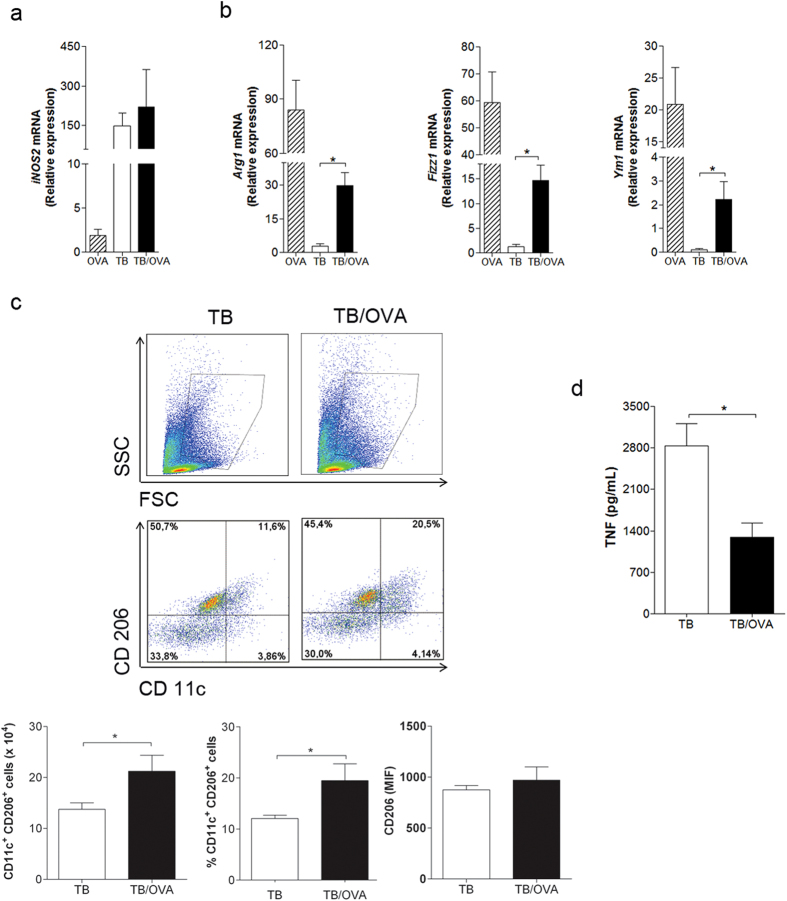
Figure 2. Allergen exposure after ongoing M. tuberculosis infection results in the mixed expression of M1/M2 markers in lung.
BALB/c mice were infected with M. tuberculosis and then sensitized and challenged with OVA, as depicted in Fig. 1a. mRNA expression was measured by quantitative real-time PCR (a,b). The data represent the mean ± s.e.m. from 3 independent experiments (n = 4–9). Freshly cells from the lung were stained with the combination of surface markers, CD11c and CD206 and examined for flow cytometry. FSChi SSChi gate were used to detect CD11c and CD206 expression on cells (c). The data represent the mean ± s.e.m. (n = 6–7). TNF levels were evaluated in the lung homogenates (d). The data represent the mean ± s.e.m. from 2 independent experiments (n = 14–15) *p < 0.05.

