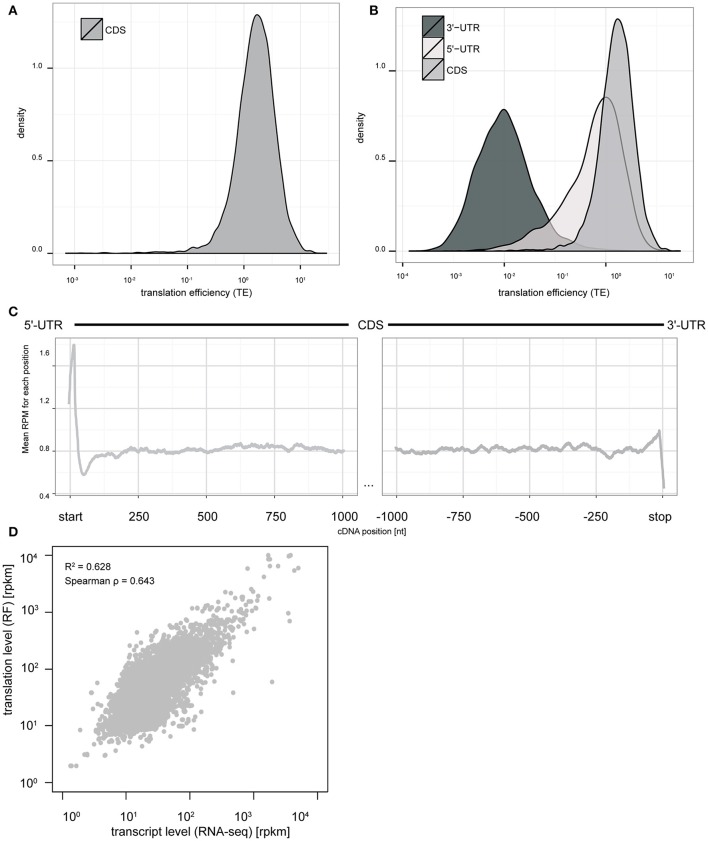
Figure 2.
Ribosome footprinting of primary cultures allows nucleotide resolution analysis of translation levels and efficiency. (A) The distribution of TE measures across CDS of all transcripts spans more than three orders of magnitude (log10 scale). (B) Comparison of TE distributions between UTRs and CDS indicates efficient ribosomal occupancy of both CDS and 5′UTR, but not 3′UTR. (C) Metagene analysis at nucleotide resolution indicates a peak of ribosome footprints at the start codon and stop codon consistent with initiation and termination being slower than elongation rates (y-axis: mean CPM across all transcripts with CDS length >= 2000 bps. x-axis: nucleotide position relative to start/stop codons). (D) Scatterplot comparing transcript levels for mRNAs (RNAseq, in log10 RPKM scale) to translation levels (RF, in log10 RPKM scale). Fitting a model indicates variation in transcript levels can account for 62.8% of the variance in translation levels (p < 2e–16).

