
Figure 4.
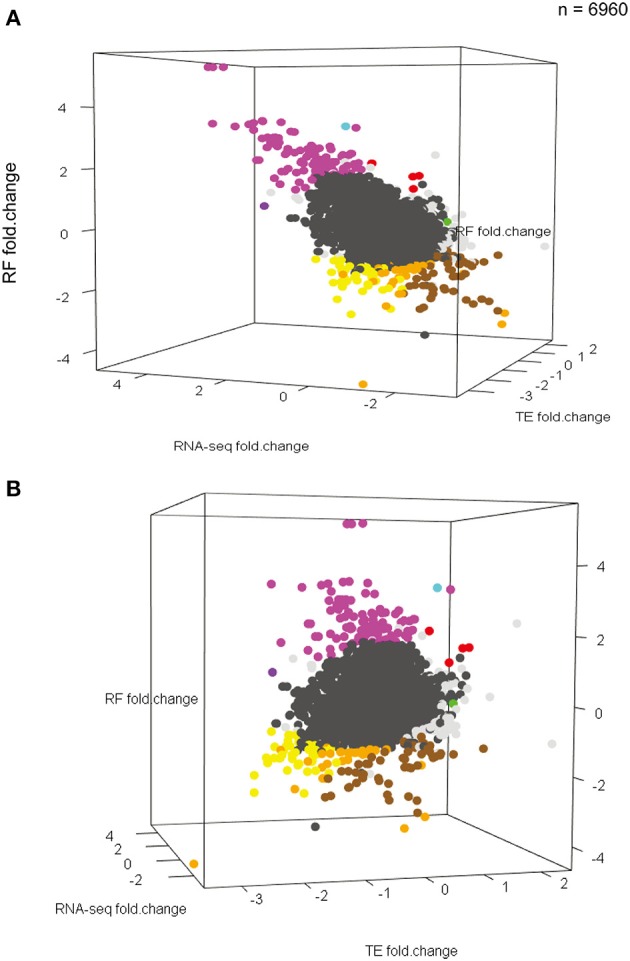
KCl stimulation results in a continuum of different transcriptional and translational responses. (A,B) Two different perspectives of a three-dimensional scatterplot showing the distribution of RNAseq changes, RF changes, and TE changes (all in log2 scale) in response to KCl stimulation for all 6960 measurable transcripts. Points for transcripts changing significantly in any dimension are bold. Colors correspond to patterns in Figure 3 (Note: Darker-gray dots represent the rest of 6616 transcripts). Though a range of patterns is seen, responses do not fall into apparently discrete clusters.