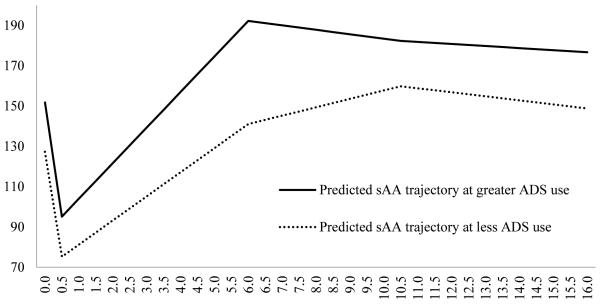
Figure 2.
The association between total ADS days and alpha-amylase diurnal slopes
Notes
Salivary alpha-amylase (sAA) levels were measured in Um/L.
sAA trajectories were based on parameter estimates in Model 3, the between-person (total) ADS days effect model as presented in Table 3.
Greater ADS use was defined as one standard deviation (SD) above the average ADS days.
Less ADS use was defined as one standard deviation (SD) below the average ADS days.

