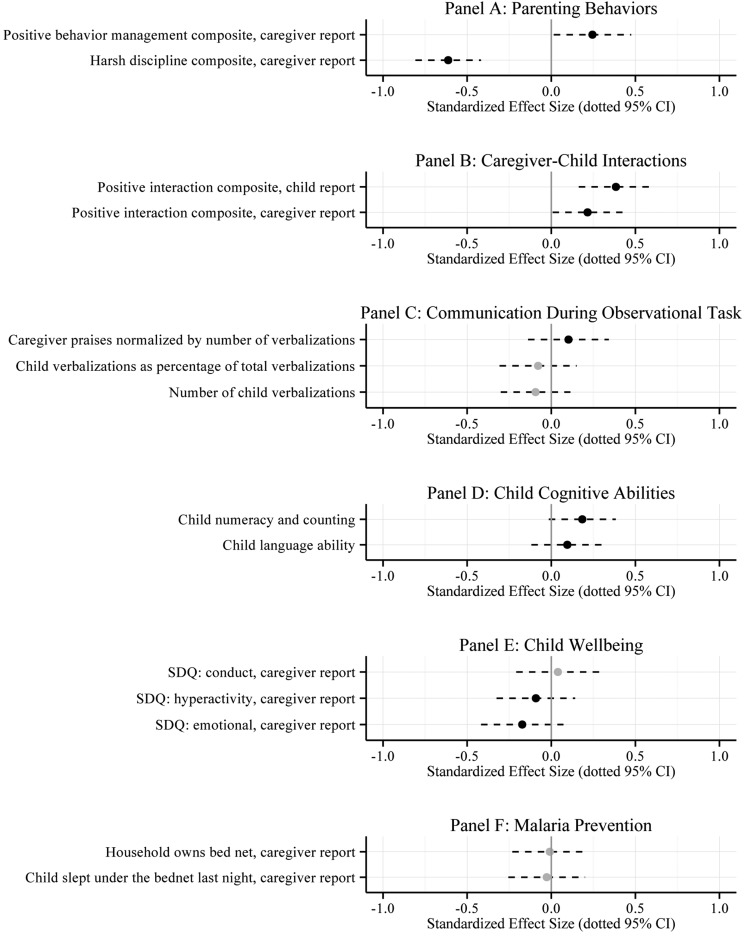
Fig. 2.
This plot displays standardized results of intention-to-treat (ITT) ordinary least squares (OLS) regressions of each primary and secondary outcome on an indicator of assignment to treatment, stratum fixed effects, and baseline covariates. The point estimates were standardized by dividing the coefficient on assignment by the control group standard deviation (Glass's Δ). Black dots represent point estimates in the hypothesized direction (grey if not in the hypothesized direction). Dotted lines represent 95% confidence intervals (CI).

