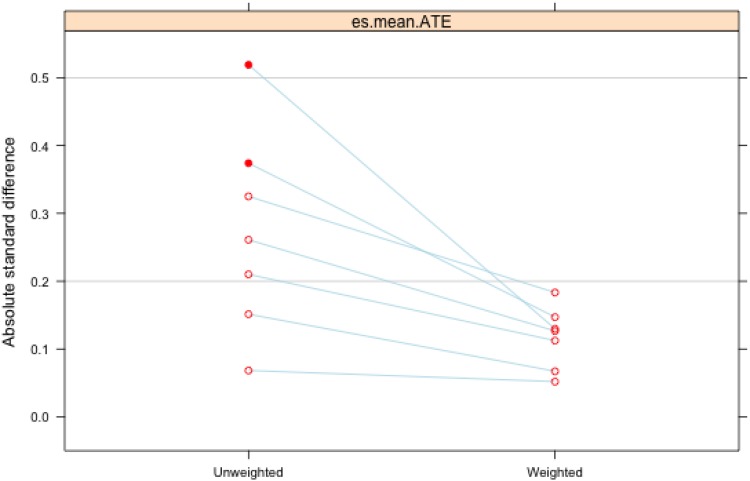
Fig. 2.
Plot of the maximum absolute standardized mean difference (ASMD) of covariates. Points on the left (‘Unweighted’) represent maximum ASMD (across the three treatment groups) prior to weighting and are connected by lines to the corresponding value of the same covariate's maximum ASMD following weighting on the right (‘Weighted’). Values less than 0.2 indicate adequate balance between treatment and control groups.

