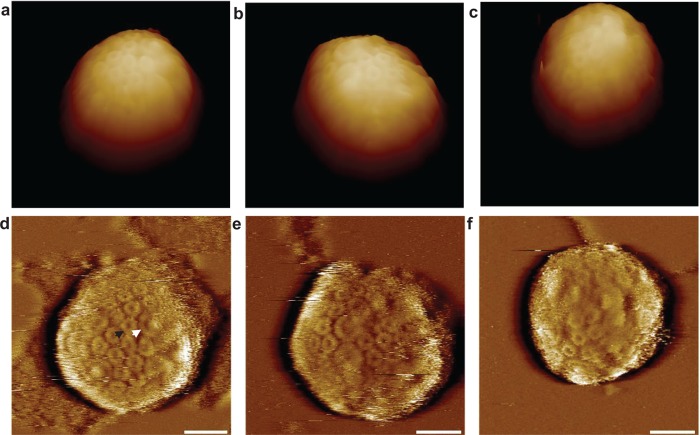
Figure 2.
Example high-resolution AFM images of chromatophore vesicles in their native state. (a–c) 3D representations of topographic AFM images of the chromatophore vesicles; (d–f) corresponding high-pass-filtered images (see Supporting Information Section 3). The larger ring (white arrow in (d)) is the LH1 complex that surrounds the RC (the higher feature in the center), and together they form the core RC-LH1-PufX complex. The smaller rings (black arrow in (d)) are LH2 complexes, which surround the core complex and cover most of the vesicle surface. The 3D images were low pass filtered to remove the line noise and are displayed with an xy:z aspect ratio of 1. Black to white for (a), (b), and (c) is 50, 45, and 50 nm, respectively. Scale bars are shown in the high-pass-filtered image and represent 20 nm. The images were taken in 300 mM KCl/20 mM MOPS, pH 7.4.

