
Figure 7.
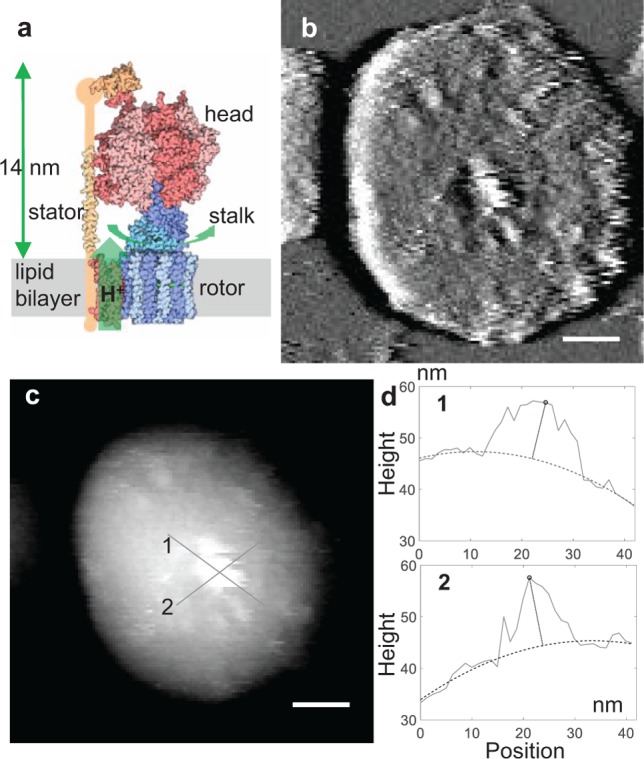
AFM image of an ATPase in a chromatophore vesicle. (a) Structure of an ATP synthase (ATPase) (Goodsell, D. doi: 10.2210/rcsb_pdb/mom_2005_12). ATPase is made up of a “rotor”, “stalk”, “head”, and “stator”. The proton motive force rotates the “head” relative to the “stalk”, and the mechanical energy is used in ATP synthesis. (b) High-pass-filtered image of a vesicle with an ATPase in the center with LH2 rings and core complexes nearby. (c) Unfiltered height image of the same vesicle as in (b) with two lines of cross section used to calculate the height of the ATPase. (d) Two profiles showing the height of the ATPase (distance of the highest point from the curved lipid background). For profile (1), the height is 11.2 ± 0.7 nm, while it is 13.5 ± 1.0 nm for profile (2). The error in the height estimation is the standard deviation of the residuals of the fit to the lipid background. Scale bars in (b) and (c) represent 20 nm. Black to white in (c) is 37 nm.