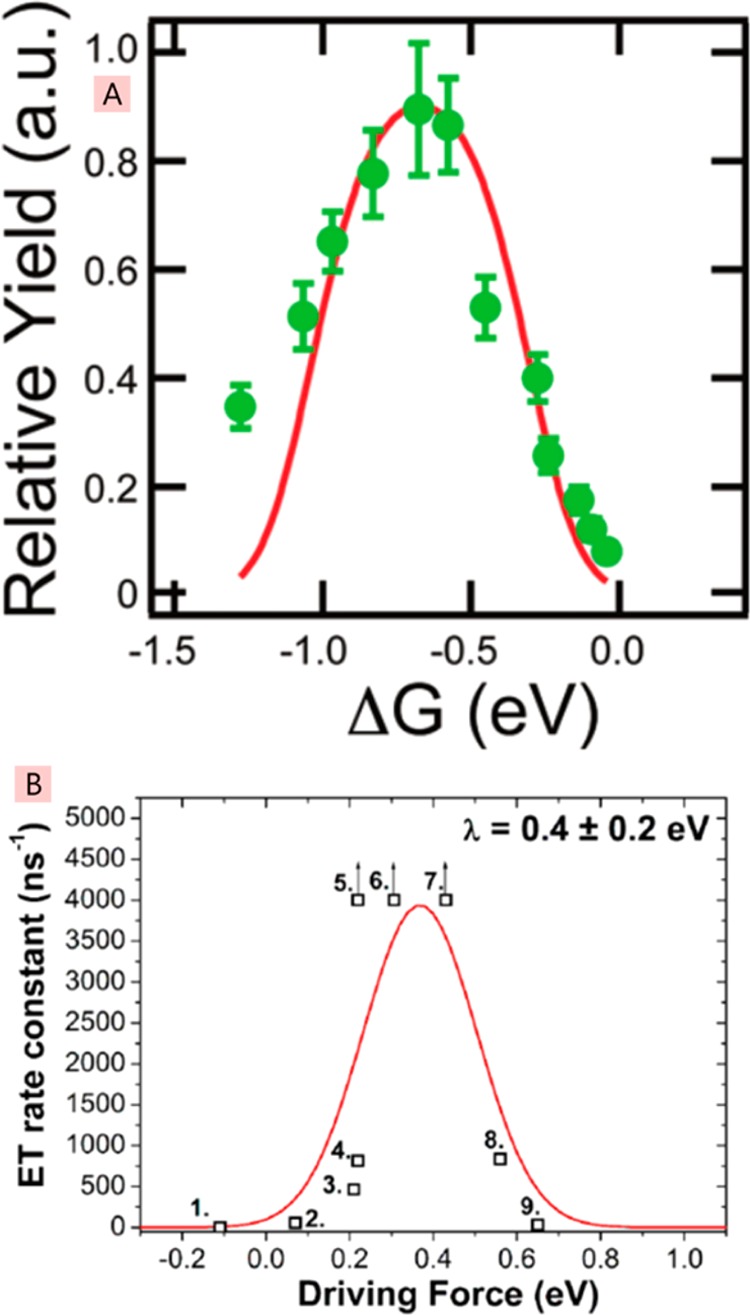
Figure 17.

Yield of mobile charge carriers (A) and the rate constant for electron transfer (B) plotted against the driving force ΔG. Points 5–7 in the bottom panel have arrows denoting that they are lower limits. Panel A reprinted with permission from ref (168). Copyright 2012 American Chemical Society. Panel B reprinted from ref (81) and licensed under CC-BY-4.0.
