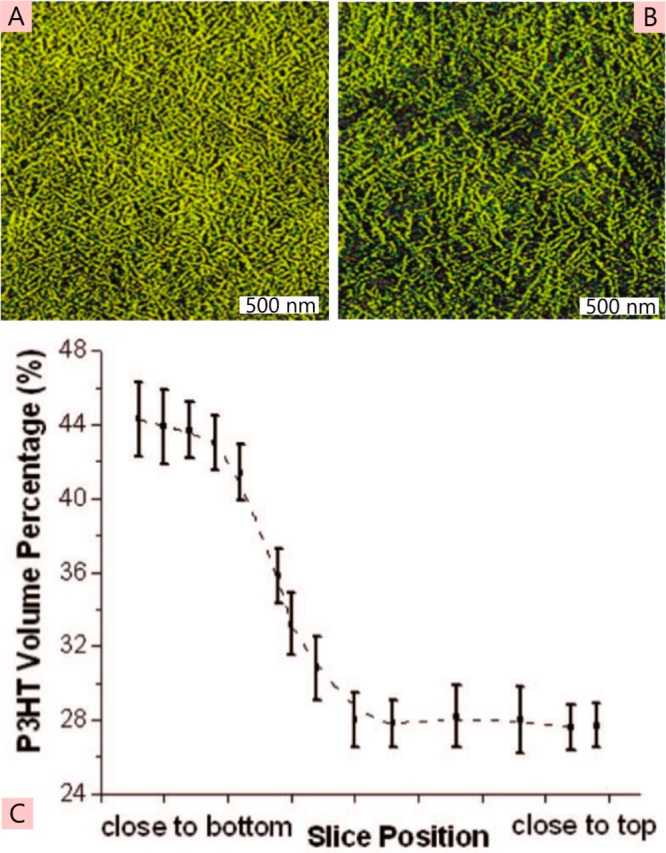
Figure 34.

TEM tomography slices of a 100–200 nm thick P3HT:PC61BM blend film, with P3HT indicated by the color yellow. Slices are taken toward the bottom of the film (A) and toward the top of the film (B), indicating differences in the amount of P3HT. This can enable the P3HT volume percentage as a function of z-position in the film, as shown in panel C, to be measured. Reprinted with permission from ref (208). Copyright 2009 American Chemical Society.
