
Figure 3.
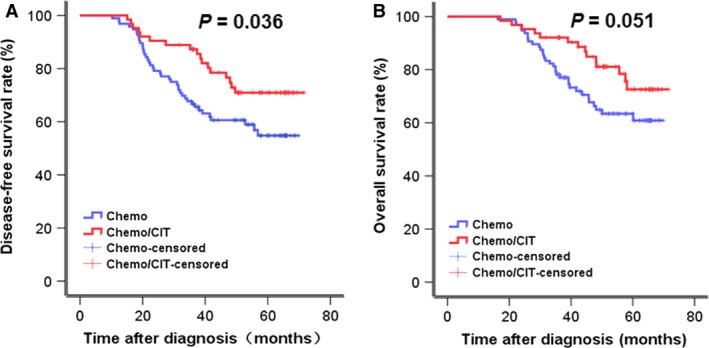
Clinical outcomes of patients who received chemotherapy or chemotherapy plus CIT. Kaplan‐Meier survival analysis was used to compare three‐year DFS and OS rate between the chemo and the chemo/CIT group (DFS, 60.6% vs 74.7%, P = 0.036; OS, 64.9% vs 83%, P = 0.051).