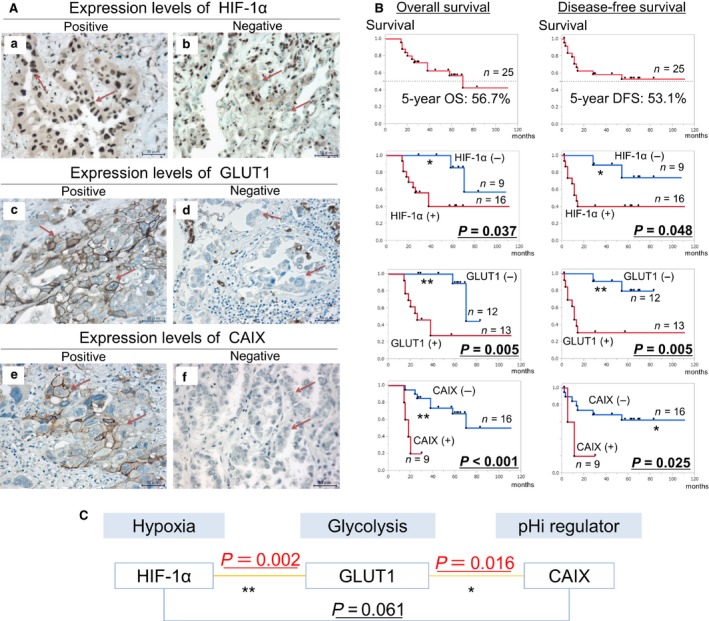
Figure 4.

Analysis of the associations between HIF‐1α, GLUT1, and CAIX expression and prognosis of NSCLC patients after induction chemoradiotherapy. (A) Representative images of the immunohistochemical staining of NSCLC sections with anti‐HIF‐1α (a and b), GLUT1 (c and d), and CAIX (e and f) antibodies. (a, c, and e) show positive expression, whereas (b, d, and f) show negative expression. (Scale bar, 50 μm, Original magnification, 400×.) (B) Results of Kaplan–Meier method and log‐rank test showed that HIF‐1α, GLUT1, and CAIX expression was significantly associated with poor OS and DFS of NSCLC patients who received induction chemoradiotherapy (OS: HIF‐1α, P = 0.037; GLUT1, P = 0.005; CAIX, P < 0.001; DFS: HIF‐1α, P = 0.048; GLUT1, P = 0.005; CAIX, P = 0.025). *P < 0.05, **P < 0.01. (C) Mutual association was observed between the expression of HIF‐1 and GLUT1 and between the expression of GLUT1 and CAIX (Chi‐squared test: HIF‐1α–GLUT1, P = 0.002; GLUT1–CAIX, P = 0.016), but not between the expression of HIF‐1α and CAIX (P = 0.061). *P < 0.05, **P < 0.01. HIF‐1α, hypoxia‐inducible factor 1α; GLUT1, glucose transporter 1; CAIX, carbonic anhydrase IX; NSCLC, nonsmall cell lung cancer; OS, overall survival; DFS, disease‐free survival.
