
Figure 2.
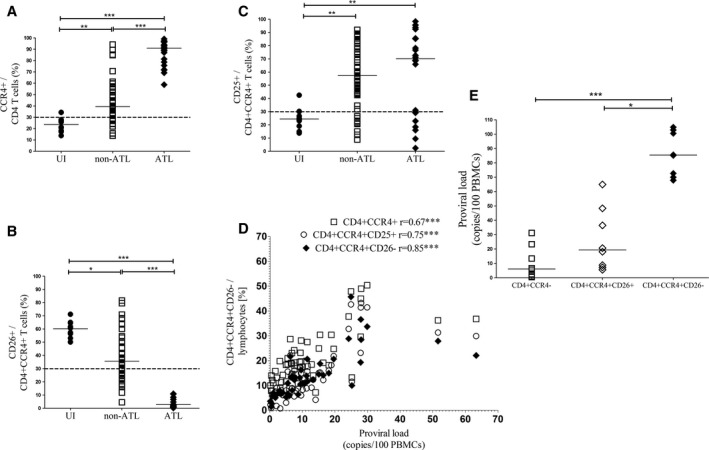
Immunophenotype of human T‐lymphotropic virus type 1 (HTLV‐1)‐infected cells: Aligned column plots showing significant stepwise change in CCR4+ (A) and CD26+ (B) within CD4+ and CD4+ CCR4+ T cells, respectively, from uninfected individuals (UI) through patients with non‐ATL to ATL HTLV‐1 infection. All ATL had CD4+ CCR4+ CD26− immunophenotype. (C) CD25+ cells were higher in patients with non‐ATL and ATL compared to UI, but there was no difference between non‐ATL and ATL. (D) XY plots showing proviral load (PVL) had stronger correlation with CD4+ CCR4+ CD26− than CD4+ CCR4+ and CD4+ CCR4+ CD25+ T cells in non‐ATL HTLV‐1 infection. (E) Aligned column plots showing significantly higher PVL within sorted CCR4+ CD26− compared to CCR4− and CCR4+ CD26+ CD4 T‐cell subsets. The bar represents median values and the dotted line the cutoff for positive expression. Statistical analysis: Kruskal–Wallis test with Dunn posttest, 95% confidence interval, and Spearman test, respectively. * denotes P < 0.05, ** denotes P < 0.01, *** denotes P < 0.001. r= Spearman correlation coefficient.