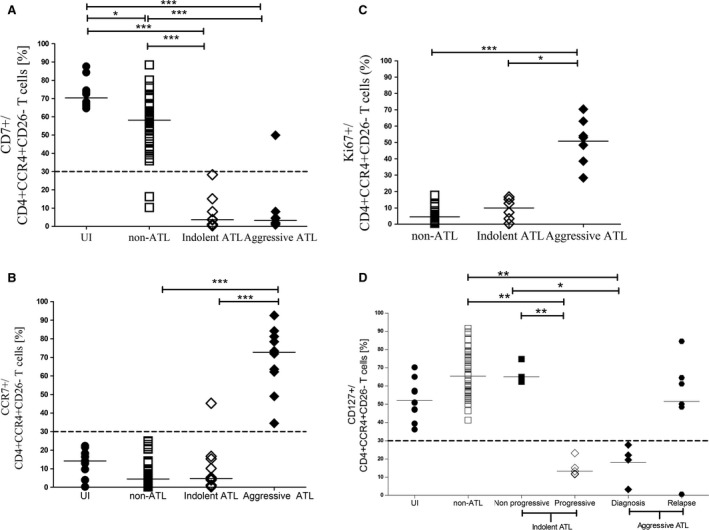
Figure 3.

Immunophenotype for diagnosis and prognosis of ATL: Gated on CD4+ CCR4+ CD26− cells (A) Aligned column plots showing significant stepwise decrease in CD7+ cells (A) from UI through patients with non‐ATL to ATL HTLV‐1 infection. CCR7+ (B) and Ki67 (C) cells were significantly higher in patients with aggressive ATL compared to non‐ATL and indolent ATL. CD127+ cells (D) were significantly lower in indolent ATL with progressive lymphocytosis compared to those with nonprogressive lymphocytosis and non‐ATL HTLV‐1 infection. The bar represents median values and the dotted line the cutoff for positive expression. Statistical analysis: Kruskal–Wallis test with Dunn posttest, 95% confidence interval. * denotes P < 0.05, ** denotes P < 0.01, *** denotes P < 0.001.
