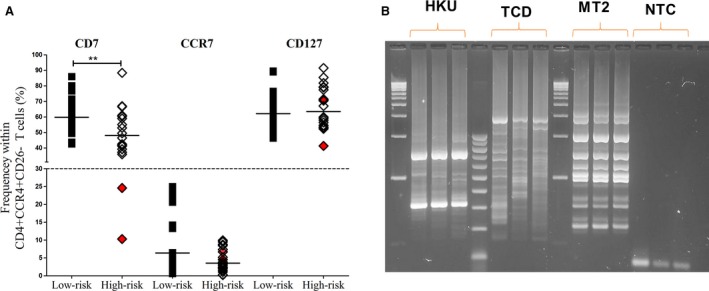
Figure 4.

“‘ATL‐like” cells in non‐ATL human T‐lymphotropic virus type 1 (HTLV‐1) infection. (A) Aligned plots of CD7, CCR7, and CD127 expression in patients with low‐risk (PVL <10%) and high‐risk (PVL≥10%) HTLV‐1 infection. Two patients with non‐ATL HTLV‐1 infection (HKU and TCD) had “ATL‐like” (CD7−) immunophenotype as highlighted in red color. Statistical analysis: Spearman test. * denotes P < 0.05, ** denotes P < 0.01, *** denotes P < 0.001. r= correlation coefficient. (B) Integration site analysis by vectorette showing presence of dominant band. MT2 and NTC are positive and negative control, respectively.
