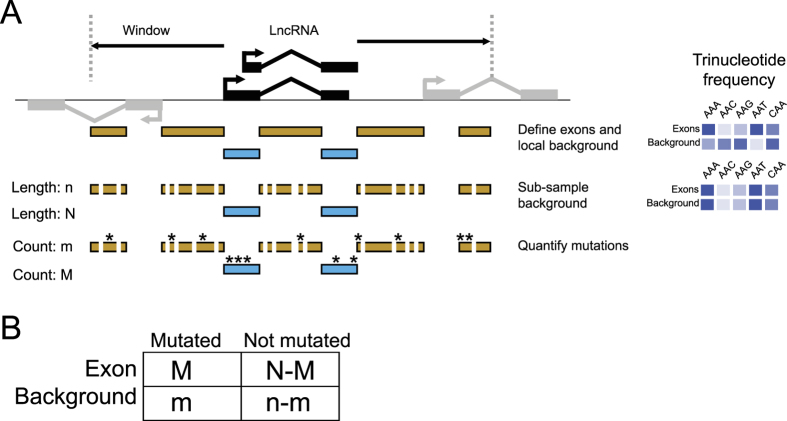
Figure 1. Outline of the ExInAtor method.
(A) The steps of gene definition, subsampling and analysis performed to quantify exonic and background mutations. Sampling is performed in such a way that, at the end, the trinucleotide frequency of the background region is identical to the exonic region. (B) The number of mutations in background and exonic regions is compared by a contingency table analysis.

