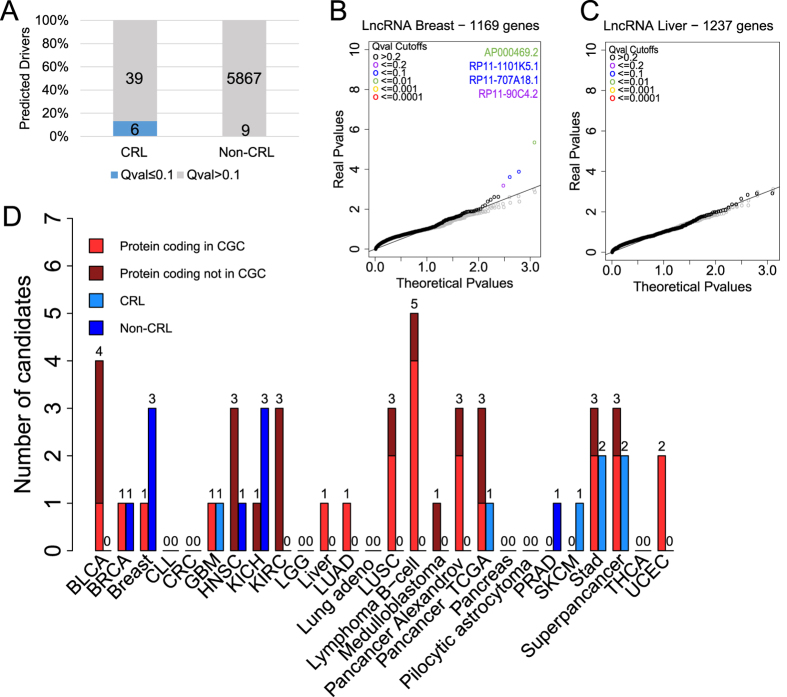
Figure 2. The landscape of driver lncRNAs across 23 tumour types.
(A) The numbers and proportion of literature-reported cancer-related long noncoding RNAs (CRL) and non-CRL candidates identified in this study. Q value is equivalent to false discovery rate (FDR). (B) A Quantile-Quantile (QQ) plot showing the performance of ExInAtor on Breast cancer mutations. Each point represents one gene. Note the deviation of real P values from the theoretical distribution in a small tail of cases. Simulated data was created by randomising mutations while maintaining trinucleotide context. (C) As for B, for Liver cancer. Note the lack of candidates in this dataset. (D) The number of driver genes discovered at a Q cutoff of 0.1 across the Alexandrov and TCGA collections. Cancer Gene Census (CGC) are true positive, known protein-coding cancer driver genes.

