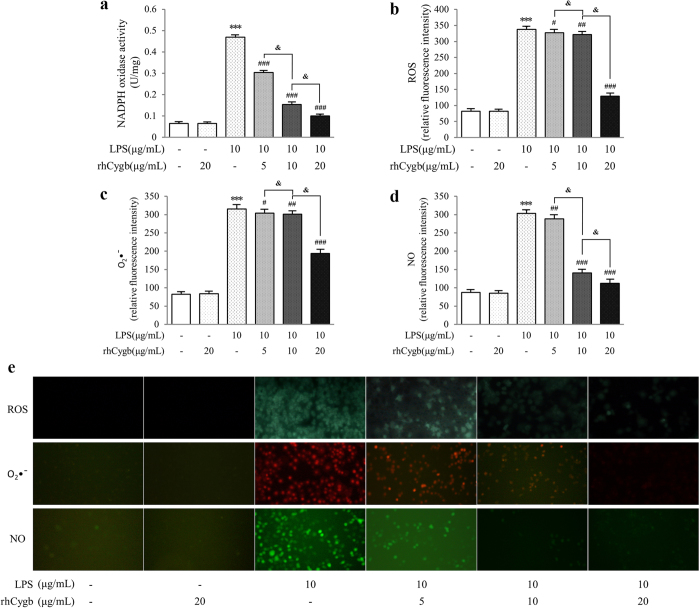
Figure 5. Effects of rhCygb on NADPH oxidase activation, ROS, O2•− and NO generation in rat Kupffer cells.
(a) NADPH oxidase activity. Cultured KCs were treated with LPS (10 μg/mL) in the presence or absence of variant doses of rhCygb (0, 5, 10 or 20 μg/mL) for 24 h. NADPH oxidase activity was then measured. Data are expressed as mean ± S.D. (n = 6). ***P < 0.001 vs. normal control; ###P < 0.001 vs. LPS control; &P < 0.05 vs. 5, 10 μg/mL rhCygb. (b–e) Intracellular productions of ROS, O2•− and NO. Intracellular ROS levels were assessed using a fluorescent probe, DCFH-DA. Fluorescence intensity was detected by multimode reader (b) and observed directly under the fluorescence microscope (e upper panels). The light green fluorescence represented intracellular ROS. Intracellular O2•− was detected by a fluorescent probe, DHE. Fluorescence intensity was detected by multimode reader (c) and observed directly under the fluorescence microscope (e, middle panels). The red fluorescence represented intracellular O2•−. Intracellular NO was detected by a fluorescent probe, DAF-FM DA. Fluorescence intensity was detected by multimode reader (d) and observed directly under the fluorescence microscope (e, lower panels). The green fluorescence represented intracellular NO. Data are expressed as mean ± S.D. (n = 12). ***P < 0.001 vs. normal control; #P < 0.05, ##P < 0.01, ###P < 0.001 vs. LPS control; &P < 0.05 vs. 5, 10 μg/mL rhCygb.

