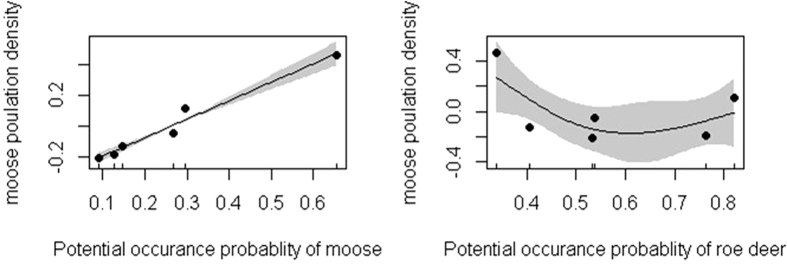
Figure 1.
Relationships between potential occurrence probability of moose and moose population density (a); potential occurrence probability of roe deer and moose population density (b) at the regional scale. Maps were created using by R software (R Development Core Team, R i386 3.1.2; www.r-project.org).

