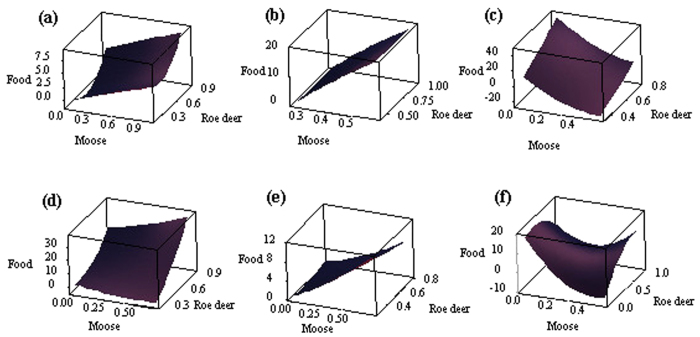
Figure 4.
Relationships from the analysis of three-dimensional surface among food availability, potential occurrence probability of moose and roe deer at local sites: Hanma (a), Shuanghe (b), Nanwenghe (c), Meitian (d), Mohe (e) and Zhanhe (f). Maps were created using by Minitab (Minitab Statistical Software, Minitab 17.0; www.minitab.com).

