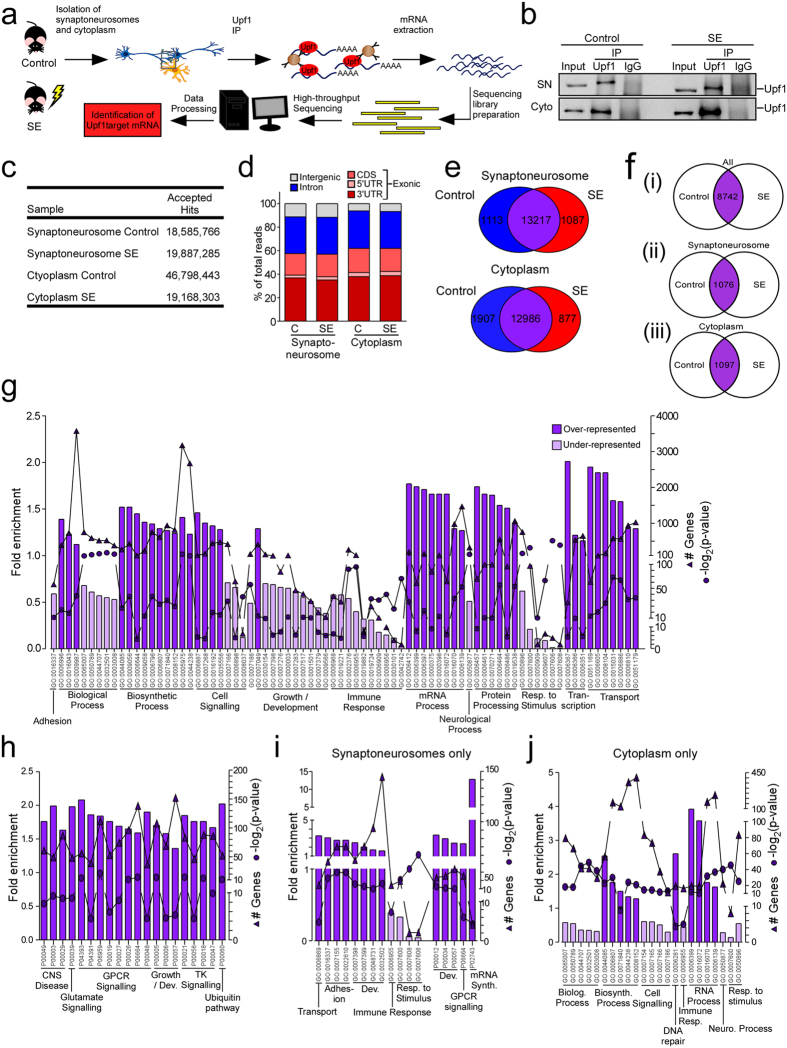
Figure 3. RIP- seq analysis of Upf1-bound transcripts in synaptoneurosomes and cytoplasm after SE.
(a) Schematic of RIP-seq experimental design. Original drawing by author Claire Mooney. (b) Immunoblot showing Upf1 pull-down in a separate experiment in samples from synaptoneurosome (SN) and cytoplasm compartments generated from hippocampi from control and SE (8 h) mice. Representative blots have been cropped to reduce unnecessary area. (c) Raw reads in each sample. (d) Distribution of raw reads from control and SE samples of cytoplasm and synpatoneurosome fractions mapped to exonic gene regions including the 3′UTR, 5′UTR and coding sequence (CDS), intronic gene regions and intergenic regions. (e) The majority of transcripts were expressed in control and SE samples in synaptoneurosomes and cytoplasm while ~15% of transcripts were exclusive to either control or SE in synaptoneurosomes and cytoplasm. (f) Venn diagrams indicate the number of unchanged/unregulated Upf1-bound mRNAs expressed in either both SN and cytoplasm factions (i) or exclusively found in either SNs (ii) or cytoplasm (iii). (g) GO analysis of the gene lists from F(i) indicates over- and under-represented GO terms and pathways associated with genes expressed in both SNs and cytoplasm. (h) Pathways associated with genes expressed in both the SN and cytoplasm. (i) Biological processes and pathways associated with genes only found in SNs (F(ii) group). (j) Biological processes related to genes only found in cytoplasm (F(iii) group).

