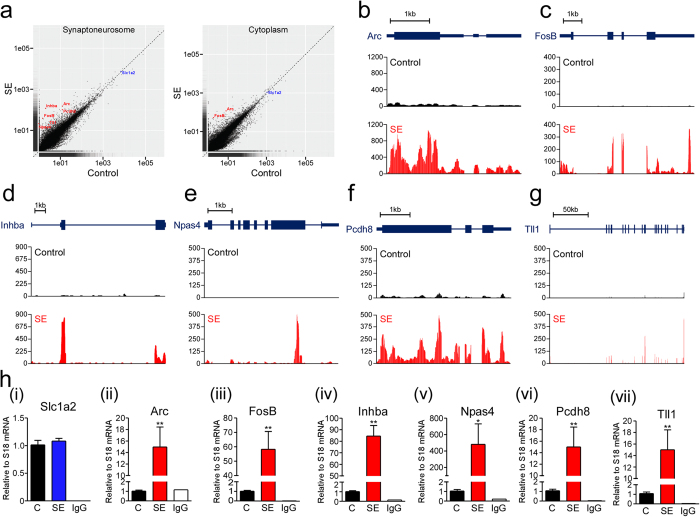
Figure 5. Validation of known and novel NMD targets identified by Upf1 RIP-seq.
(a) Each transcript identified by Upf1 RIP-seq is marked by a black dot on the scatter plot. Transcripts that were upregulated after SE and were validated using PCR are marked in red. (b-g) The distribution of reads along each transcript in control and SE samples from synaptoneurosomes is presented. Note the markedly higher levels of reads found on the indicated transcripts after SE. (h i-vii) qPCR analysis of RNA isolated from ipsilateral hippocampus from control and SE mice validating RIP-seq data by showing a significant increase in Upf1-bound transcripts after SE. IgG was used as a negative control for IP (n = 5 per group; Mann-Whitney U-test C vs SE; *p < 0.05, **p < 0.01).

