
Figure 2. Sampled areas in the Fourier space of the reconstructed volume.
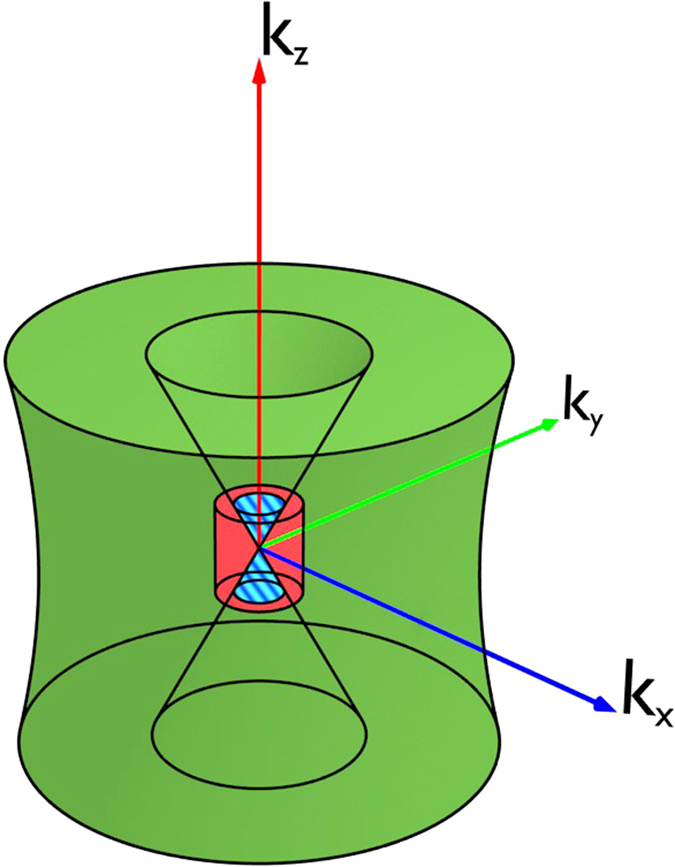
The green volume found outside the two inner cones relates to a computed laminography and the red volume to a low resolution computed tomography scan. The blue stripes correspond to the domain where the missing information in the laminography data can be reconstructed from the CT scan.